W. C. Levengood
Levengood. W.C. 1994. Anatomical anomalies in crop formation plants. - Physiol. Plant. 92: 356-363.
Crop formations consist of geometrically organized regions ranging from 2 to 80 m diameter, in which the plants (primarily grain crops) are flattened in a horizontal position. Plants from crop formations display anatomical alterations which cannot be accounted for by assuming the formations are hoaxes. Near the soil surface the curved stems often form complex swirls with 'vortex' type patterns. In the present paper. evidence is presented which indicates that structural and cellular alterations take place in plants exposed within the confines of the 'circle' type formations. differences which were determined to be statistically significant when compared with control plants taken outside the formations. These transformations were manifested at the macroscopic level as abnormal nodal swelling. gross malformations during embryogenesis, and charred epidermal tissue. Significant changes in seed germination and development were found. and at the microscopic level differences were observed in cell wall pit structures. Affected plants also have characteristics suggesting the involvement of transient high temperatures.
Keyword - Abnormal embryos, anomalous plant growth. cell wall pits, crop formations, transient heating.
W.C. Levengood, Pinelandia Biophysical Laboratory, P.O. Box 388, Grass Lake, MI 49240, USA.
Introduction
As the geometric organizations within crop formations are examined at close range or from photographs and detailed diagrams outlining the complex layered effects in the downed crop, the inescapable impression remains that very uniform, ordered forces are involved in their structuring. One might think of these field crop patterns (a typical example of which is shown in Fig. 1) as representing 'force diagrams', with the plants providing visual clues as to the type and structure of the energy involved. From these assessments, intriguing questions arise regarding the possibility of residual effects which might alter subsequent plant growth and cell forms. In 1989, we learned that scientific information related to these questions was nonexistent. The present study was undertaken to explore the hypothesis that possible residual effects might remain in plants within the confines of the formations.
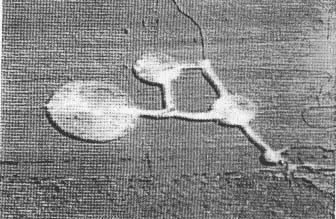
Fig. I. Typical crop formation in an oat field at Columbia,
New York. USA, 1993 (aerial photograph taken by Mr Ron Taylor of Baldwinsville.
New York). The formation (maximum diameter around 60 m) appears brighter than
the background due to a higher light reflectance off the downed, horizontal
plant stems.
Tab. 1. Crop circle sample sets exhibitine transformations.
Each sample set was microscopically examined for insect and pathogen damage.
With the exception of superficially formed mold on the exterior of seed heads
from overseas shipments (both controls and formation samples), no disease or
insect infestations were found.
| Category of transformation | Number of sets |
| Total sample sets examined | 86 |
| Increased stem node diameter | 25 |
| Suppressed embryogenesis | 22 |
| Varied cell wall pit size | 43 |
| Altered seedling development | 27 |
| Carbonization of epidermal tissue | 1 |
| No alterations observed | 7 |
| Insect or pathogen involvement | 0 |
Sample sets have been studied from crop circle formations in Canada, UK, USA and Australia, most of which occurred during the 1990-92 growing seasons. The term crop formation' is used here in the oeneric sense, that is, with reference to all crop field formations without regard to their specific geometric configuration. This particular exploratory effort included plants from wheat (Triticum aestivum), barley (Hordeum vulgare), oats (Avena sativa), corn (Zea mays), sweet flag (Acorus caluumus), soy beans (Glycine max), and from meadows containing numerous species of grasses.
To comment on each sample set would be somewhat repetitious, therefore those
discussed in detail have either particularly unusual characteristics or are
typical of materials exhibiting significant alterations compared with their
control counterparts. Listed in Tab. I are various categorized alterations which
were observed in the crop circle plants. The designated frequency of occurrence
reflects the fact that a given crop circle set may reveal more than one type of
transformation.
Materials and methods
Plant material
A typical test group contained 6-10 plants taken within the crop imprint and an equal number of normal or control plants removed from the same field at distances ranging from 10 to 300 m from the outer periphery of the formation. The majority of the test sample groups were collected within 1-5 days post formation.
Stem node measurements
Due to natural stem size variations in a plant population a size ratio method was employed to quantitatively study node differences. The diameter of the central region on a stem node (Nd) and the diameter of the stem internode (Id) at a position about 1.5 cm directly above the node, provided Rn, the node size ratio:
Rn =
(Nd/Id)
(1)
The diameters were obtained with a machinist's vernier micrometer (Central Tool Co., Auburn, RI, USA) providing a precision of 0.01 mm, and containing a ratchet to insure a constant applied pressure for each measurement. Each test sample consisted of 6-10 plants, most of which contained five growth nodes, with the first node designated at the basipetal location.
Cell wall pit diameters
Pit diameters were obtained with a precision, traveling cross hair, ocular micrometer used at 450x magnification. In each sample set a total of 30 randomly selected cell wall pits (taken outside the stomate regions) made up a test population. Since in some samples the pits were elongated, the maximum diameter was used for the analyses.
Seed germination
In test material with limited seed supplies. it was necessary to establish what may be described as a 'precision germination monitoring' of the seed responses. From each test set 20 seeds were arranged in 'paper roll' configurations (standard germination procedure) which were then inserted in a polystyrene. laboratory fabricated germination chamber (verified for temperature uniformity) held at 250C. At onset of germination (3-4 days) both the root and shoot lengths were recorded, at later stages only the seedling lengths (cotyledon plus hypocotyl). For each test sample the number of seeds germinated and mean lengths were determined. Since both the percent germinated and seedling growth are important parameters for evaluating growth potential, a quantitative 'seedling development factor' (Df) was developed for full utilization of growth data, that is,
Df = L x Fg (2)
where L is the mean seedling length (or mean root length) and Fg is the
fraction germinated out of the test sample.
Results
Termination of embryo development
One of the most consistent, widespread, physiological pertubations occurred
in wheat plants from crop formations appearing during the development stages of
anthesis and early embryo formation. If the plants were allowed to continue
development throughout the growing seas on, the seed structures at around
harvest maturity were indistinguishable in external appearance from those of the
surrounding, normal upright plants. However, I consistently found that seeds
were totally absent or extremely underdeveloped inside the glume structures from
the formation. In seed heads from crop formations occurring just prior to
fertilization, the anthers, which would normally be extruded, were found to be
still present inside all the glumes, with the subsequent absence of any seed
development.
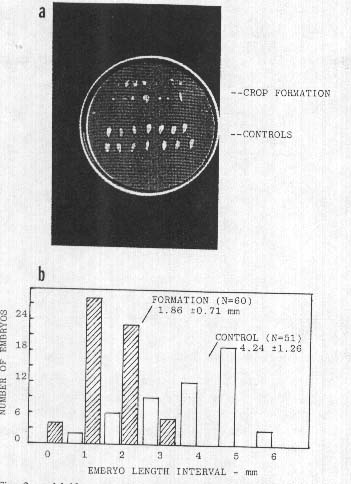
Fig. 2.
a. Malformed wheat
seeds (upper rows) from a 1991 formation at Newton St. Loe, UK, occurring at the
early, 'milky' stage of seed development; normal control seeds in lower
rows.
b. Wheat embryo size distributions from an
early, post anthesis formation in Pennsylvania, USA, 1992. Mean embryo length in
control population is 2.3 times that of embryos from crop formation
(P<0.00l).
As an example, a collection taken at Newton St. Loe, UK, on 1 July, 1991, disclosed wheat heads which externally were of normal appearance on both the control and circle plants. About 100 seeds were available from each sample group. Observation with a 5x hand magnifier revealed that 40% of the seed population taken from the circle area exhibited gross malformations, whereas the control population had 0% malformed seeds. The abnormal, circle population seeds, shown in Fig. 2a, consisted of brown-colored, completely flattened seeds in addition to those with tissue within the embryo region extending outward from the shrunken endosperm. These plants were sampled at the 'milky' stage of development and consequently the endosperm had not completely filled the seeds. Most of these deformations could be explained by the cessation of development followed by a premature dehydration which began at the time of the crop circle formation, that is, about 12 days prior to the laboratory examination. By comparison the control plants apparently continued to develop throughout this interval and did not manifest dehydration.
This persistence of altered embryo development was again observed in the 1992 collections. One of the most striking sample sets came from a wheat field in Montgomery County, PA, USA, which on 2 June, 1992, exhibited irregularly shaped crop formations. Fully hydrated plant material was received at the laboratory 9 days later. Like the 1991 collections, the wheat heads appeared normal externally; however, in heads from the formation, embryos were, as shown in Fig. 2b, less than one-half the size of the controls. As was the case in many other sample sets the reproductive development appeared to be terminated at the time of the crop formation, which in this case was just following anthesis.
Expansion of stem nodes
Another noticeable feature along the wheat plant stems was the appearance of thicker growth nodes or pulvini, particularly those located midway along the stem axis. Shown in Fig. 3a are differences in the mean ratios (Rn expressed as percent change relative to controls) for plants taken from a wheat field at Lockeridge, UK, on 21 June, 1991 (one set from within a circle and a second set from a surrounding outer ring). A general peaking of node size ratio values at the apical regions of the plant is shown in Fig. 3b for two circle formations within the same field of barley (Lockeridge, UK, 1992). The collector reported that these circles are remote from the tractor wheel lines in the field, with no visible access track to them'.
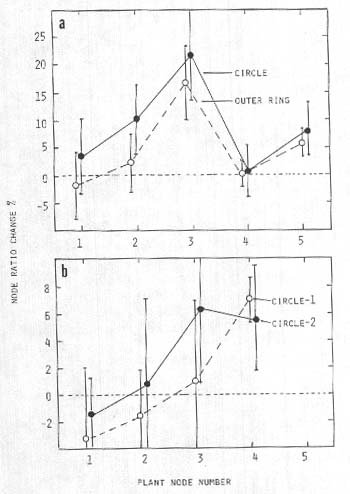
Fig. 3. Node size ratio changes (Rn) in crop formations
relative to controls,
a, Circle with outer ring
in wheat at Lockeridge, UK. 1991, P<0.05 for both points at
node-3.
b, Two circle formations within the same
field of barley at Lockeridge, UK, 1992; P <0.05 for apical
nodes.
Tab. 2. Comparison of cell wall pit diameters (n = 30 per
sample) and germination of seeds (n = 20 seeds, paper roll germ.)
from
a) intentionally downed or lodged plants in
a wheat field (Carson Farm, UK, 4 Aug, 1993),
b)
intentionally downed plants at a different location in same field,
and
c) the central form (Silbury Hill, UK. 20
Aug, 1992) in a ring complex, compared with lodged and verical
control.
Sample population means +/- SD.
Values followed by different letters are significant at
P<0.05.
Sample type
|
Cell wall pit diameter
um
|
Seedling development
6 days |
||
Celeoptile (cm) |
Fraction Germinated |
Df |
||
| a) Location-I | ||||
| Downed | l.75 ± 0.27a | 3.07 ± l.08a | 1.00 | 3.07 |
| Control | l.76 ± 0.25a | 2.92 ±l.08a | 0.95 | 2.77 |
| b) Location-2 | ||||
| Downed | l.67 ± 0.26b | 2.76 ± 0.86h | 0.90 | 2.48 |
| Control | l.87 ± 0.26c | 3.17 ± 0.97h | 1.00 | 3.17 |
| c) Center of formation | 2.26 ± 0.50d | 3.19 ± l.28c | 0.90 | 2.87 |
| Control I (Lodged) | l.86 ± 0.24e | 2.18 ± l.00d | 0.80 | 1.74 |
| Control 2 (Lodged) | l.86 ± 0.37e | 2.33 ± 0.76d | 0.90 | 2.10 |
| Control 3 (Vertical) | 1.81 ± 0.27e | 2.25 ± 0.88d | 0.65 | 1.46 |
This situation was later explained by the crop owner as being due to excessive nitrogen application, resulting in color change, weakened plant stems producing lodging, and enlarged, bent nodes. This sample group was important in several respects. First, it demonstrated that enlarged node ratios cannot be used exclusively as a crop circle verification. Second, the absence of malformed embryos suggested that soil nitrogen is not a factor in this type of transformation. Finally. it suggested that the presence of a deeper green leaf color would be an indication that a crop formation might be caused by the application of excess nitrogen.
Analyses of cell wall pit fields and seed germination
The after effects of the crop circle forces could be detected in bracts contacting the wheat seed, where the cell wall pits are relatively uniform in size and evaluations could be conducted in early, in mature and in dehydrated, post harvested tissue. Along with observations on the crop formation plants and controls, parallel efforts were made to obtain plants intentionally downed (lodged), then shipped to the laboratory in the same manner as the formation plants. These artificially lodged samples were prepared on the Carson Farm, Alton Barnes, UK, on 4 August, 1993. Samples were taken within 24 h after the flattening and each group (a and b from different locations in the field) included normal upright controls. There were no other types of downed plant formations in this area of sampling.
The cell wall pit diameters from bract tissue and seed germination results are listed in Tab. 2, along with similar data (set c) from a ring-complex formed at Silbury Hill, UK, on 20 August, 1992. With the exception of the two naturally lodged samples (Control I and 2), test material was taken less than 24 h after the formation occurred. The intentionally lodged sample sets showed no significant seed growth differences, whereas the cell wall pit values are more variable. The circle formation samples displayed significantly higher growth in the seeds and larger cell wall pit sizes when compared with the three controls.
This suggested relationship between cell wall pit diameter (in somatic tissue) and seedling development (in germinal tissue) was more extensively examined in a 10-sample group taken at Waden Hill near Avebury, UK, on 17 July, 1992. All laboratory observations were made before the identity of each specific sample (five controls and five from the formation) was made known. Afier obtaining all the information the collective data were examined with regression analyses and in Fig. 4 the five formation samples are shown as closed circles; r=0.89 correlation coefficient.
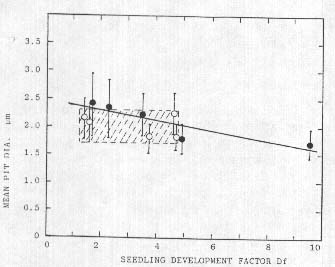
Fig. 4. Linear regression (closed points. r=0.89. P<0.05) of mean cell wall pit diameters in formation bracts and seedling Df; controls open points (r=0.34, curve not shown). Shaded rectangle emphasizes the range of values in the controls.
The five controls (open circles) show essentially no correlation (r 0.34) between pit size and seedling growth. One very important aspect to be noted in these data is the range of effects within the crop circle plants in relation to the controls (shaded rectangle in Fig. 4). Within the formation sample set the range of both seedling growth and pit size means lie on both sides of the region bounded by the controls. The inverse nature of the regression line may be related to dehydration and subsequent pit size shrinkage with prolonged exposures, as discussed in a later section. This wide range of pit size in the formation plants suggests that quite different levels of energy are expended at different sampling sites within a specific crop formation.
A similar group of samples (two sets of five) was organized from a manmade or 'artificial formation' at West Wycombe, UK, on 12 July, 1992. and as in the preceding case the laboratory work was completed before any details were submitted regarding the formation. Although there was no correlation between the Df factor and mean pit diameters (r=0.13) in the five artificial formation samples, there was an increase in the mean values of the cell wall pit sizes (possibly due to the crushing instruments). Regression analysis of the five controls also disclosed no correlation (r=0.06) between pit sizes and Df, which agrees with the analysis of the control sets in the previously discussed material (Waden Hill). From these observed variations it is quite evident that pit size alone cannot he used as a validation tool.
As depicted in Tab. 2 and Fig. 4, the Df factors from the crop formation samples can have values significantly higher than their controls, a situation which, as will be shown presently, has taken place in sample sets from widely different locations and plant species. What makes this positive growth a distinct feature of the crop circle formations is that it is diametrically opposite the response one would expect to observe in seeds which by comparison with their controls have shrunken and wrinkled seed coats, and in some cases reduced seed weights' conditions known to reduce viability and vigor in seeds (Roberts 1972).
In a corn (Zea mays) field in Medina. NY. USA, a crop formation was sampled on 7 October. 1991 (formed 3 weeks prior to this date). The corn was still in the husks and there was no outward difference in the appearance of these plants (except for the lodging). The seeds (sample A taken at center of a l0-m diam. formation, B at the edge and C the control about 20 m outside the formation) were removed from the cob and dried down to 13% moisture. When the seeds were viewed under oblique, white light illumination. differences were observed in their external appearance. The pericarp membrane covering the embryo region revealed a much higher density of lateral wrinkles in the crop formation samples. indicating a greater degree of endosperm shrinkage. Incomplete endosperm development is common in downed plants growing under suboptimum conditions. This was further indicated by the fact that both circle samples had seed weights 25-30% less than the control seeds. Cell wall pit data were obtained from bracts at the base of the corn seeds; in the B sample the pits were 18% larger and in the A sample 41% larger than those of the C sample (both differences sionificant at P<0.05). The early (5-day) seedling growth data in Fig.5a are completely reversed from what would be expected from seeds developing under suboptimum conditions. The 10-day seedlings in Fig. Sb show that these differences remain throughout the germination stage. Similar results were obtained in a repeat germination test conducted 15 months after the formation occurred.
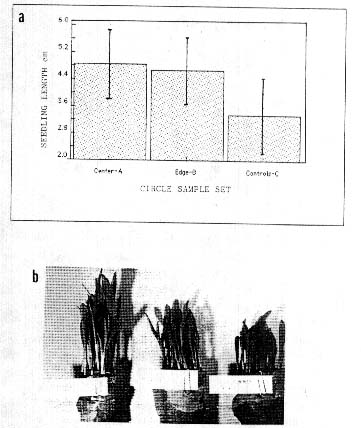
Fig. 5. Devclopment differences in seeds from a formation
occurring in mid to late maturity field corn, (Zea mays). at Medina. NY.
USA. in 1991.
a. Seedling development at 5-day
growth stage (20 seedlings per test).
b. 10-day
shoots in germination paper rolls.
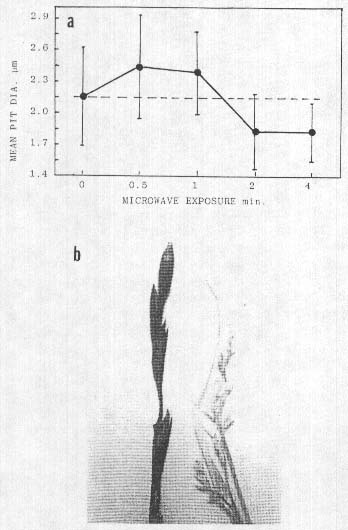
Fig. 6. a. Effect of microwave heating on cell wall pit size
in wheat bract tissue (30 measurements per point), all points P<0.05 compared
with control level (dashed line). Points lying below line indicate shrinkage due
to dehydration. b. Uniform charring of epidermal, waxy layer (leff) on plants
taken at points of intersection of a 'Y' inside a ring formation at Cornwall.
UK. 1991: plant on right is typical of those taken in the path but outside the
points of intersection.
At this juncture in
our studies only a very speculative proposal can be advanced as to the causation
of this positive growth response. In literature discussing crop circle
formations, reference has been made (Meaden 1991) to the possible involvement of
ion plasma vortices. At this point we will not be concerned with where or how
they are formed, but simply the consequences of their presence. The formation of
discreet, internal electric fields is a common characteristic of ion plasmas in
which charge separation develops. The interaction of a plasma-associated
electric field with a plant could, under the proper conditions, induce
intracellular electrophoretic currents which have been shown to significantly
stimulate growth in root primordia under conditions of brief exposure (Levengood
1991).
Transient heating involved in cell wall pit changes
In general. cell wall pit enlargement appears to be the result of an
expansion of the cell wall. possibly due to a very rapid heat input which would
cause the cell cytoplasm to expand, stretch out the lavered cellulose
microfibrils in the cell walls. and increase the diameter of the cell wall pits.
Since plant cell walls have visco-elastic properties (Ortega 1990), the pits.
after heating and expanding. would not return to their original diameter.
Thermal input effects were examined by exposing wheat heads from normal
control plants (midsummer growth, USA) to microwave energy using a 600 W
commercial source (model MVP Ill. Magic Chef, Cleveland. TN, USA). The pit
diameters were determined in the same manner as in the crop circle material. The
data in Fia. 6a show a maximum pit expansion at the 0.5-mm exposure, amounting
to a 14% increase (P<0.05), but with prolonged exposure significant
reductions in the pit diameters were noted at 2 and 4 mm. This pit size decrease
can be attributed to tissue dehydration produced by the longer microwave
treatment. The heat input over the 30-s interval of maximum pit expansion was
determined by exposing a known volume of water (100 ml) in a 6-cm diameter
beaker.
An empirical value of 0.107 J cm-2 s-' was calculated from the heat capacity of water (4.185 J per oC rise in temperature). If microwave energy is involved in the crop formations, the amount of heating would depend on plant water content. Internal moisture can vary from 50 to over 90%, depending on the tissue type (Kramer 1969). In the case of barley (one of the crop formation species we examined) the water content can be as high as 93% in the apical region (Kramer and Wiebe 1952).
Further indications of a rapid heat involvement were noted in plant material exhibitino carbonization or charring of the epidermal tissues. This superficial carbon layer (confirmed independently by two outside laboratories) as shown in Fig. 6b, formed a very uniform non-reflecting black coatino over the entire plant. These grass type samples were taken 7 July, 1991, from a flattened formation in Cornwall, UK, consisting of a circular ring path about 0.5 m wide and 20 m diameter. Inside the ring, a path of similar width formed a 'Y' shape and at the junction points where the Y intersected the outer ring. the black-coated plants were seen, but were not observed at other locations along the paths. This uniform carbon black film appeared to be the result of a very rapid. heat-produced, oxidation in the suberized, waxy type layer which is normally present on the outer epidermal cells of plants. Epidermal cells below the carbon layer were not charred; however, the parenchyma cell walls were ruptured with obvious gaps and breaks. The cell walls of inner tissues within leaves and stems at other locations outside the black areas, but in the paths, were not ruptured. This carbonization and cell wall rupture suggests that the heat input rate within these intersecting regions may have been of considerably greater magnitude than the energy involved in other formations exhibiting cell wall pit changes.
Discussion
There are common aspects among the anomalous features listed in Tab. I which provide clues to the general forces producing crop formations. The affected plants have components which suggest the involvement of rapid air movement, ionization, electric fields and transient high temperatures combined with an oxidizing atmosphere. One naturally occurring and organized force incorporating each of these features is, as previously mentioned, an ion plasma vortex, one very high energy example being a lightning discharge.
Atmospheric-associated plasma formations may plausibly originate in regions where there are clear indications of energy exchange between the ionosphere (60-100 km) and electrical storms in the upper atmosphere (Franz et al. 1990). Currently under consideration are ion plasma vortices which form in unstable regions and act as heat and angular momentum transporters. In fluid dynamics, gases, including air, are considered as having liquid properties (Prandtl and Tietjens 1957). In such a scheme the descent of a vortex through a liquid produces unstable secondary products which form complex, symmetrical patterns such as circles, rings, triangles, double lines and ovals with tubes or 'paths' extending from them (Levenoood 1958). In its descent to the crop surface the shaping of these features of vortex instability would be guided by variations in the Earth's magnetic field (Rossi and Jastrow 1961). At the crop surface the heat, ionization, associated electric fields and angular momentum would be transferred to the living plants. Taken as a whole, ionized air plasmas are electrically neutral, althouoh internally, charge separation takes place and they can have high concentrations of positive ions and free electrons (Lehnert 1961), which in contact with plant tissue might produce transient heating and account for a number of the plant transformations.
Microwave energy was used to impart rapid, invasive thermal energy in the range of 0.107 J cm-2 5-', a level sufficient to produce cell wall pit expansion in bract tissue (Fig. 6a). Microwave energies are known to be associated with ion plasmas; however, attempts to detect both low radio frequency (100 Hz to 20 kHz) and high radio frequency (peak around 500 MHz) electromagnetic fields associated with crop formations (Taylor 1993) have produced negative results when they are examined after the fact. So far there have been no measurements done as a formation develops.
Although the source of the transient heating remains unknown, one may obtain some idea of its magnitude by comparing the energy to produce cell wall pit expansion with the normal heat energy input under field conditions.
The solar flux energy over the entire spectrum is 0.14 J cm-2 5-'. By no means all of the solar radiation is available as heat energy. About one-third of the total solar output is thermal energy, most of which is located in the infrared region. Taking this 1/3 value gives the energy available for heating the plant tissues as 0.047 J cm-2 s-' The ratio of energy necessary for cell wall pit enhancement to that available from solar heating is 0.107/0.047 2.28; that is, under field conditions the solar flux is less than 1/2 the energy necessary to produce cell wall pit enhancement. In scanning electron microscope (SEM) studies, anomalous 'blisters' (in the size range of 2-10 microns) have been reported on the pericarp of wheat seed from crop formations (McDonough 1993). Of the several possible causes advanced, a rapid heat input would best explain the localized eruptions of the pericarp matrix.
One characteristic feature of the entire world collection of crop formations is the appearance of a recurrent kinetic process that never seems to exactly repeat itself. Even in cases where the mechanism appears to be governed by forces which may be precisely defined mathematically, as for example the cardiold form in the primary geometry of the 'Mandelbrot' formation (Ickleton, UK, 1991), their long-term evolution is fundamentally unpredictable. In an attempt to reconcile this unpredictability with empirical results obtained over the last 2 years, the complex energy processes are being considered within the framework of a kinetic oscillating system operating under conditions of deterministic chaos. It has been argued that since the geometric patterns are 'complex and non-random', they are not explainable within the current scientific paradigms (Wingfield 1990). The scientific literature abounds with references to deterministic systems in which unpredictable, highly complex, non random geometric forms are produced (Madore and Freedman 1987). Many of these recurrent processes have been shown to have selforganizing structures similar in form to the most complex of the crop formations.
If within these crop formations, there are several forms of energy involved, then under chaotic conditions they would be expected to operate somewhat independently of one another. Slight instabilities within these energy systems could disrupt a dynamically operating chaotic system to the point of influencing the quantitatively determined plant development factors in an unpredictable manner. Any relationship one may find between empirically determined development parameters, as for example in Fig. 4, might be expected to be a 'special case' for that particular formation. This special situation was confirmed by the fact that later observations from formations with similar sampling numbers and procedures did not disclose the same relationship between pit size seed development. It is quite apparent that any hypothesis needs to be organized from a much larger data base than is presently available. Complex crop formations such as those examined during the last 3 years will require considerable in-depth investigation before one can accept or discard a working hypothesis based on deterministic chaos principals.
Acknowledgements - My profound thanks to John Burke for his constant
encouragement, backed up with excellent sample supplies, to Ron Taylor for the
aerial photograph, to Pat Delgado, Linda M. Howe, Nancy Talbort, Michael Chorost
and Monty Keen for prompt responses to sample requests, and especially to Chad
Deetken and Mathew Moniz for corroborative germination testing.
References
Franz, R. C., Nemzek, R.J. & Winkler, J.R. 1990. Television image of a large upward electrical discharge above a thunderstorm system. - Science 249: 48-51.
Kramer. P.J. 1969. Plant and Soil Water Relationships: A Modern Synthesis. -
McGraw-Hill Book Co., New York. NY p.5.
- & Wiebe, H. H. 1952.
Longitudinal gradients of P32 absorption in roots. - Plant Physiol. 27:
241-245.
Lehnert. B. 1961. Stability of an inhomogeneous plasma in a magnetic field. - Physics Fluids 4: 525-526.
Levengood, W. C. 1958. Instability effects in vortex rings produced with
liquids. - Nature 181: 1680-1681.
- 1991. Electrophoresis in plant cell
organelles. - Bioelectrochem. Bioenerg. 25: 225-239.
Madore, B. F. & Freedman, W. L. 1987. Self-organizing structures. - Am. Sci. 75: 252-259.
McDonough. C. 1993. Scanning electron microscopy. - In Report on the Results of Project Argus: An Instrumental Study of the Physical Materials of Crop Circles (M. Chorost, ed.), pp.27-35. Project Argus Report, do North American Circle, P.O. Box 61144, Durham, NC 27715-1144.
Meaden, G.T. 1991. Circles from the sky-a new topic in atmospheric research. - In Circles From the Sky (0. T. Meaden, ed.). pp. 11-52. Souvenir Press, London. ISBN 0-285-63036-9.
Ortega. J. K. E. 1990. Governing equations for plant cell growth. - Physiol. Plant. 79: 116-121.
Prandtl, L. & Tietjens, O.G. 1957. Fundamentals of Hydro- and Aeromechanics. - Dover Pub., Inc., New York, NY. p.2.
Roberts, E. H. 1972. Viability of Seeds. - Chapman and Hall Ltd., London, UK. pp. 216-217.
Rossi. B. & Jastrow, R. 1961. Results of experiments in space. -In Science in Space (L. V. Berkner and H. Odishaw, eds), pp. 49-88. McGraw-Hill, New York, NY.
Taylor, R. 1993. Electromagnetic field detection. - In Report on the Results of Project Argus: An Instrumental Study of the Physical Materials of Crop Circles (M. Chrost, ed.), p.42. Project Argus Report, c/o North American Circle, P.O. Box 6114, Durham, NC 27715-1144.
Wingfield, G. 1990. Beyond the current paradigms. In The Crop Circle
Enigma (R. Noyes, ed.), pp. 99-110. Gateway Books, Bath, UK. ISBN 0-946551-75-8.