STUDY
BACKGROUND:
 In
1996 local geologist Diane Conrad visited a crop circle which
had occurred near her home in Logan, Utah. The formation,
the first one reported in the general area, caused quite a
stir locally and resulted in a local radio interview with
Nancy Talbott about the BLT Research Team's previous crop
circle research and results. In that interview Michigan scientist
W.C. Levengood's hypothesis that some sort of atmospheric
plasma system might be involved was discussed at length--in
particular the fact that plants and soils at cropcircle sites
had been shown by Levengood et al. to exhibit abnormalities
consistent with their exposure to brief bursts of intense
heat. Also pointed out was the fact that plasmas are known
to emit microwaves when they spiral, and thus could be a possible
source of this heat. In
1996 local geologist Diane Conrad visited a crop circle which
had occurred near her home in Logan, Utah. The formation,
the first one reported in the general area, caused quite a
stir locally and resulted in a local radio interview with
Nancy Talbott about the BLT Research Team's previous crop
circle research and results. In that interview Michigan scientist
W.C. Levengood's hypothesis that some sort of atmospheric
plasma system might be involved was discussed at length--in
particular the fact that plants and soils at cropcircle sites
had been shown by Levengood et al. to exhibit abnormalities
consistent with their exposure to brief bursts of intense
heat. Also pointed out was the fact that plasmas are known
to emit microwaves when they spiral, and thus could be a possible
source of this heat.
Having written her Master's Thesis on heat effects on clay minerals, Ms. Conrad reasoned that certain expandable clays in the soils at cropcircle sites might provide additional evidence of this heating action. If the soils, and these expandable clay minerals (illites/smectites), had been exposed to unusual heating it was possible that a change in the degree of crystallinity might have occurred. Since Ms. Conrad was familiar with both the particular measure of crystallinity (the Kubler Index) and the X-ray diffraction (XRD) methodology utilized to obtain this information, she decided to carry out preliminary testing on the 1996 Logan, Utah crop circle soils.
Ms. Conrad's results from this preliminary XRD investigation were intriguing. The soil sample from within the crop circle showed a pronounced decrease in the Kubler Index of the illite peak, as compared to the control (S=0.11; C=0.25), indicating increased crystallinity in the circle sample. Ms. Conrad then took the 3 remaining aliquots of the control sample and heated the first in a conventional oven for ten minutes at 93ßC and the second for ten minutes at 287ßC; the third was microwaved for two minutes to determine the effects of energy of different wavelengths on the crystal structure. In these three heated control samples the Kubler Index consistently decreased (from 1.0 to 0.07), with the microwaved aliquot producing a Kubler Index most similar to that of the circle sample.
|
|
For details of the 1996 Logan, Utah
cropcircle report, click on BLT Lab
Report #79 (left). |
It must be kept in mind that this increase in degree of crystallization (greater ordering of the atoms) in clay minerals has not been documented in surface soils before. Such changes are typically seen in sedimentary rock which has been exposed--for hundreds, if not thousands, of years--to both heat from the earth's core and the massive pressure of tons of overlying rock. If such a change were to be demonstrated (with statistical significance) in surface soils in an in-depth study at crop circle sites, it would certainly inspire increased academic interest in the causative mechanism behind the crop circle phenomenon.
In 1999 New York philanthropist Laurance S. Rockefeller provided BLT Inc. with the funds needed to implement this in-depth XRD examination of expandable clay minerals (illites/smectites) in crop circle soils.
STUDY CASE
SELECTION:
A number of crop circles in several countries were considered as potential candidates for this study, and there were multiple factors which guided our final choice. We relied heavily on the research published by W.C. Levengood et al. (1994; 1995; 1999) over the years to help us choose a productive study case, and paid specific attention to BLT Lab Report #79 (see above) which states that both multiple expulsion cavities and statistically significant apical node-length increases were documented in the plants in the Logan, Utah crop formation. Additionally, we noted that the crop-lay in the upper-most plants in both circles in the Logan formation had been more radial than spiral (radial crop-lays are less common than spiral lays).
Four crop circles (one in Holland, one in the U.S. and two in Canada) were evaluated preliminarily as candidates for this study. All of these cases provided statistically significant apical node-length increases in the plants, as well as the presence of expulsion cavities, and two had the radial lay in evidence. Preliminary XRD examination of the soils in all but the Holland case also suggested increases in the crystalline structure of the illite/smectites in the soils.
In the Holland event we had a reliable eye-witness to the circle forming underneath a disc-shaped light which had hovered over the field, but the soils from this field were extremely rich, containing very little clay, and it became apparent that the extraction of the clays in preparation for X-ray diffraction was not cost-effective for this study. The U.S. case not only had node-length increases and expulsion cavities present, it also was one of the first cases where the massively twisted and spiraled stem at the base of the seed-head was observed. However, the field-team in this instance had misunderstood the sampling protocol and there were not enough controls available. And, in one of the two Canadian cases, the farmer had mowed quite a bit of the field surrounding the formation prior to the BLT field-team's sampling, thus making it impossible to obtain both plant and soil samples at all the required locations.
 |
 |
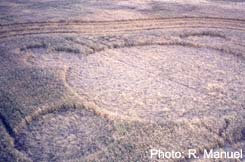
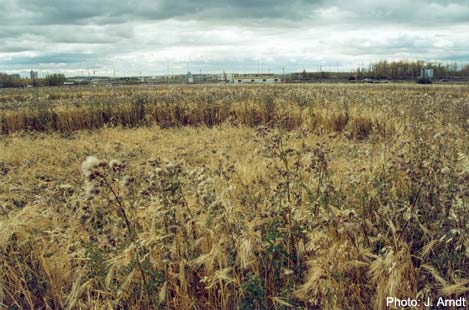
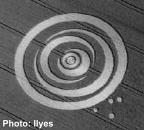
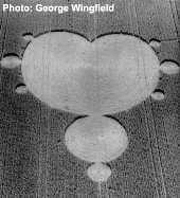
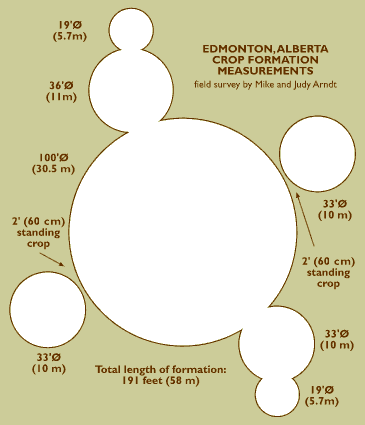
The fourth case, a seven-circle formation (overall length 191 ft.) in barley at Edmonton, Alberta, Canada in September, 1999 was the only case of the four which could be examined within our budget and which also met all of our basic criteria and, so, it was chosen for the in-depth XRD study. Unknown to us at the time, this Edmonton formation would turn out to be one of the most interesting crop circles we have studied so far.
 |
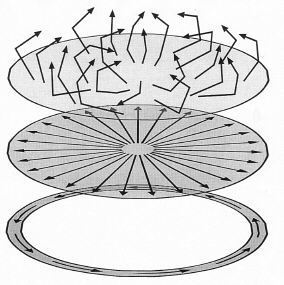
The apical node elongation was so extreme at Edmonton that it was clearly visible in the field (and subsequently confirmed to be statistically significant by W.C. Levengood), and the sampling-team found massive numbers of expulsion cavities all the way down the barley stems, in some instances involving the apical node also. The lay of the crop in all seven circles was complex, with an uppermost layer chaotically laid in varying directions, a radially-laid layer beneath that, with an underlying, narrow, counter-clockwise ring of flattened crop around the perimeter of each of the seven circles.
 |
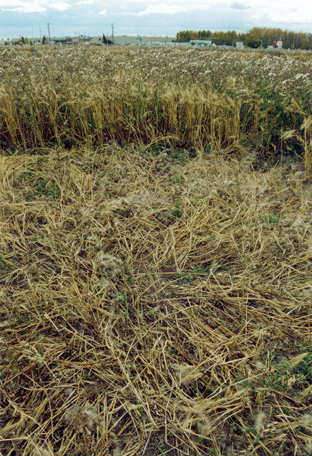 |
Diagram and Photo: J. Arndt |
This formation was found by the farmer (who subsequently reported that he had observed multiple circles the previous year in an adjacent field, which he had thought might be caused by deer bedding down) at harvest, and was not visible from the nearest roads. The fact that the field was infested with Canadian thistle, which made it almost impossible to walk in the field without high protective boots, tended to further rule out the possibility that this formation had been mechanically produced.
 |
Finally, fieldworkers Mike and Judy Arndt--in spite of the Canadian thistle--carried out a thorough, comprehensive sampling and precise documentation of the field situation, thus making this Edmonton case overall the best candidate. For those knowledgeable about the crop circle phenomenon it is interesting to note that, during the sampling work, cell-phone failure inside the circles was observed by the Arndts and unusual aerial light phenomena was reported by the farmer and his wife and at least one other unrelated individual during the time-period when this formation was thought to have occurred.
|
|
|
To read the entire original BLT Lab Report #122
on the Edmonton case, click on diagram at left.
|
SAMPLING
PROCEDURE:
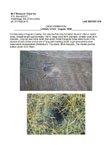
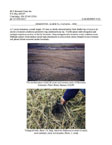
Plant samples, consisting of 15-20 plants/sample, cut off at just above the soil level, were taken along multiple diameters at precise intervals (which varied, depending upon overall circle size) in three of the seven circles that made up the Edmonton crop formation. In some samples the number of plants/sample varies because of the heavy infestation of thistle, which made it impossible in every sampling location to obtain 15-20 plants adjacent to each other. Magnetic North was determined by the field-team and, in two of the sampled circles, this diameter was sampled.
Previous plant research had indicated that, in crop formations comprised of multiple-sized circles, the most significant plant changes often occur in the smaller-diameter circles. The field-team was unable to complete the full sampling of the smaller circle in this case, in spite of which the plant data revealed interesting results.
Plant controls, also consisting of 15-20 plants/sample cut off at the base, were taken along four different control lines beginning at 75 ft. away from the flattened edges of various sections of the formation and continuing to between 175 ft. - 265 ft. away from the flattened edges, at 25 ft. intervals. (Click on sampling diagrams below to see in full size.)
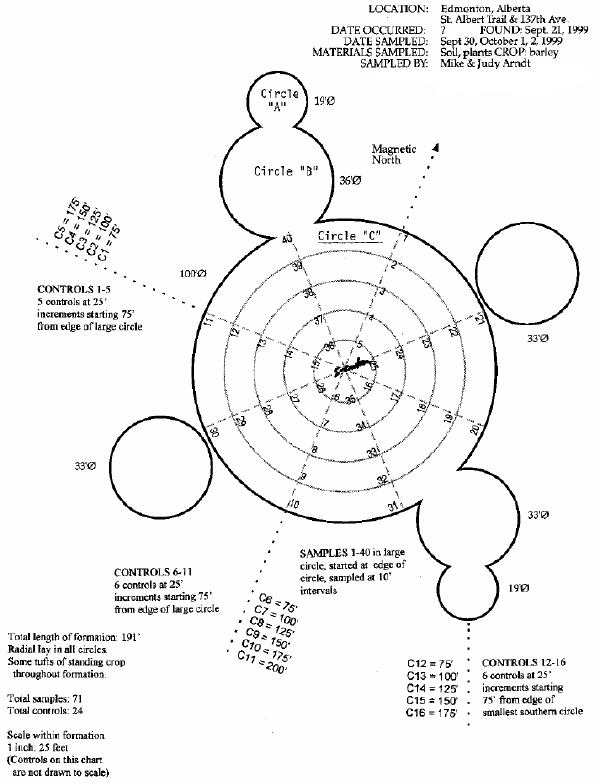
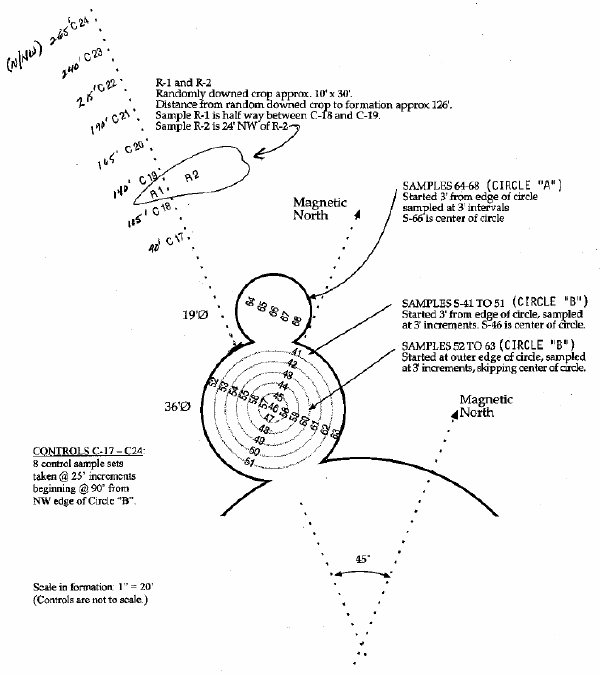
All plant samples and controls were wrapped in newspaper, secured and labeled with the appropriate sample or control number, and dropped in situ until the soil sampling had also been completed. Each sample and control location was registered on the field sampling diagram.
Soil samples and controls, consisting of approximately 1/2 cup of surface soil at each location (down to a depth not exceeding 1/2 inch), were taken immediately around each plant sampling location and then placed in plastic bags and labeled.
The fieldwork took three days to complete (September 30, October 1 & 2, 1999), after which the plant samples were allowed to dry for an additional three weeks, prior to shipping to Michigan for the initial plant and soil analyses.
PLANT
RESULTS:
 Twenty-three control sets (approx. 230 plants) and seventy-one sample sets (approx. 710 plants) were examined by Michigan biophysicist W.C. Levengood. Two of the most reliable indicators (node-length increase and the presence of expulsion cavities) that an unusual energy system had impacted the plants inside the flattened circles were found. [Both of these abnormalities are thought to be caused by a rapid, intense exposure of the plants to heat (microwaves?) which turns the internal stem moisture to steam. Depending on (a) the elasticity of the plant fibers (younger tissues are more elastic), (b) the amount of moisture inside the plant stems, and (c) the intensity and/or duration of the heating agency itself, the steam either stretches the apical node of the plant and/or bursts holes through the lower nodes as it escapes. See published papers, 1994; 1995; 1999.] Twenty-three control sets (approx. 230 plants) and seventy-one sample sets (approx. 710 plants) were examined by Michigan biophysicist W.C. Levengood. Two of the most reliable indicators (node-length increase and the presence of expulsion cavities) that an unusual energy system had impacted the plants inside the flattened circles were found. [Both of these abnormalities are thought to be caused by a rapid, intense exposure of the plants to heat (microwaves?) which turns the internal stem moisture to steam. Depending on (a) the elasticity of the plant fibers (younger tissues are more elastic), (b) the amount of moisture inside the plant stems, and (c) the intensity and/or duration of the heating agency itself, the steam either stretches the apical node of the plant and/or bursts holes through the lower nodes as it escapes. See published papers, 1994; 1995; 1999.] |
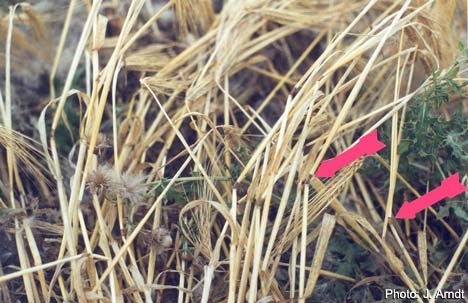
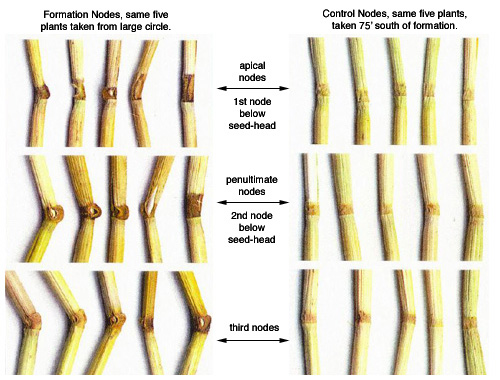
(1) Expulsion cavities (holes blown out at the plant stem nodes) were found in 68% of the 71 plant sample sets; none were found in the 23 control sets. These expulsion cavities were found not only in the apical node (1st node beneath the seed-head) and in the penultimate node (2nd node beneath the seed-head), but also in the third node beneath the seed-head--with multiple expulsion cavities observed in many of the plant stems, the first time that this had been documented in the laboratory.
(2) Apical node-elongation levels in all of the 71 plant sample sets were significantly higher (p <0.01) than the overall control level. All three sampled circles disclosed very significant node-length increases, with the plants from the smallest circle showing the greatest node-elongation (+109%). The 5 tables below contain the complete plant data obtained by W.C. Levengood.
|
Table 1:
Plant Data - Controls
Edmonton, Canada Crop Circle
September, 1999
|
|
CONTROL
LOCATION |
CONTROL
NUMBER |
MEAN APICAL
NODE LENGTH (mm) |
EXP.
CAVITIES/
SAMPLE SET
(APICAL NODES) |
NUMBER
OF PLANTS
PER SET* |
|
|
|
75' |
W |
C-1 |
3.22
mm |
0 |
9 |
|
100' |
W |
C-2 |
3.13
mm |
0 |
9 |
|
125' |
W |
C-3 |
2.97
mm |
0 |
11 |
|
150' |
W |
C-4 |
3.18
mm |
0 |
10 |
|
175' |
W |
C-5 |
3.33
mm |
0 |
10 |
|
|
|
75' |
S |
C-6 |
2.93
mm |
0 |
10 |
|
100' |
S |
C-7 |
3.09
mm |
0 |
10 |
|
125' |
S |
C-8 |
3.44
mm |
0 |
10 |
|
150' |
S |
C-9 |
3.44
mm |
0 |
10 |
|
175' |
S |
C-10 |
3.72
mm |
0 |
10 |
|
200' |
S |
C-11 |
4.91
mm |
0 |
10 |
|
|
|
75' |
SE |
C-12 |
3.72
mm |
0 |
10 |
|
100' |
SE |
C-13 |
3.34
mm |
0 |
10 |
|
125' |
SE |
C-14 |
3.32
mm |
0 |
10 |
|
150' |
SE |
C-15 |
2.97
mm |
0 |
10 |
|
175' |
SE |
C-16 |
2.73
mm |
0 |
11 |
|
|
|
90' |
NW |
C-17 |
3.21
mm |
0 |
10 |
|
115' |
NW |
C-18 |
3.05
mm |
0 |
11 |
|
140' |
NW |
C-19 |
3.35
mm |
0 |
10 |
|
165' |
NW |
C-20 |
3.44
mm |
0 |
10 |
|
190' |
NW |
C-21 |
3.23
mm |
0 |
10 |
|
215' |
NW |
C-22 |
3.92
mm |
0 |
10 |
|
240' |
NW |
C-23 |
3.71
mm |
0 |
8 |
|
265' |
NW |
C-24 |
- |
- |
- |
|
| *Notes: |
|
|
|
|
|
|
(1) |
Number of plants/set in this chart reflects the number of plants which arrived at the laboratory fully intact and, thus, usable for the study. |
|
(2) |
No plant data was presented for Control #24 (C-24).
|
|
|
Table 2:
Plant Data - Samples, Circle "C"
Edmonton, Canada Crop Circle
September, 1999 |
|
SAMPLE # |
MEAN
APICAL
NODE LENGTH (mm) |
EXP. CAVITIES/
SAMPLE SET
(Apical Nodes Only) |
NUMBER
PLANTS/SET |
|
[Circle "C," 100' diameter center circle]
|
|
S-1 |
4.51 mm |
3 |
8 |
|
S-2 |
5.54 mm |
0 |
11 |
|
S-3 |
5.92 mm |
4 |
9 |
|
S-4 |
5.20 mm |
5 |
9 |
|
S-5 |
6.19 mm |
2 |
10 |
|
S-6 |
5.62
mm |
3 |
10 |
|
S-7 |
5.51 mm |
2 |
9 |
|
S-8 |
7.56 mm |
0 |
7 |
|
S-9 |
5.89 mm |
1 |
9 |
|
S-10 |
5.36 mm |
1 |
10 |
|
|
|
|
|
|
S-11 |
4.35 mm |
1 |
10 |
|
S-12 |
4.84 mm |
4 |
10 |
|
S-13 |
5.04 mm |
6 |
10 |
|
S-14 |
4.92 mm |
3 |
10 |
|
S-15 |
6.46 mm |
3 |
10 |
|
S-16 |
5.71 mm |
1 |
11 |
|
S-17 |
5.34 mm |
0 |
8 |
|
S-18 |
5.15 mm |
2 |
10 |
|
S-19 |
5.34mm |
0 |
9 |
|
S-20 |
6.98 mm |
1 |
10 |
|
|
|
|
|
|
S-21 |
4.61 mm |
2 |
9 |
|
S-22 |
5.86 mm |
0 |
12 |
|
S-23 |
5.34 mm |
3 |
10 |
|
S-24 |
4.89 mm |
0 |
10 |
|
S-25 |
5.83 mm |
0 |
10 |
|
S-26 |
6.60 mm |
0 |
11 |
|
S-27 |
6.81 mm |
0 |
10 |
|
S-28 |
5.62 mm |
4 |
10 |
|
S-29 |
4.70 mm |
1 |
10 |
|
S-30 |
5.86 mm |
0 |
10 |
|
|
|
|
|
|
S-31 |
5.28 mm |
0 |
9 |
|
S-32 |
6.06 mm |
4 |
10 |
|
S-33 |
6.44 mm |
4 |
12 |
|
S-34 |
6.26 mm |
7 |
8 |
|
S-35 |
4.97 mm |
4 |
10 |
|
S-36 |
4.91 mm |
1 |
7 |
|
S-37 |
7.17 mm |
2 |
9 |
|
S-38 |
4.58 mm |
4 |
10 |
|
S-39 |
4.59 mm |
0 |
9 |
|
S-40 |
4.93 mm |
0 |
10 |
|
"C"-Center |
5.50 mm |
1 |
9 |
| |
|
|
|
|
|
Table 3:
Plant Data - Samples, Circle "B"
Edmonton, Canada Crop Circle
September, 1999
|
|
SAMPLE # |
MEAN APICAL
NODE LENGTH (mm) |
EXP. CAVITIES/
SAMPLE SET
(Apical Nodes Only) |
NUMBER
PLANTS/SET |
[Circle "B," 36' - diameter NW circle]
|
S-41 |
5.77 mm |
0 |
9 |
S-42 |
6.90 mm |
0 |
9 |
S-43 |
6.92 mm |
0 |
9 |
S-44 |
6.14 mm |
0 |
10 |
S-45 |
4.93 mm |
3 |
11 |
S-46 |
5.47 mm |
3 |
7 |
S-47 |
5.09 mm |
5 |
10 |
S-48 |
6.38 mm |
0 |
12 |
S-49 |
5.88 mm |
2 |
10 |
S-50 |
5.96 mm |
3 |
10 |
S-51 |
4.43 mm |
0 |
11 |
|
|
|
|
|
S-52 |
5.98 mm |
4 |
10 |
S-53 |
5.96 mm |
2 |
10 |
S-54 |
5.92 mm |
2 |
10 |
S-55 |
5.64 mm |
0 |
11 |
S-56 |
6.45 mm |
0 |
10 |
S-57 |
3.40 mm |
10 |
10 |
|
S-58 |
4.95 mm |
5 |
11 |
S-59 |
6.45 mm |
2 |
10 |
S-60 |
5.30 mm |
3 |
9 |
S-61 |
6.04 mm |
2 |
9 |
|
S-62 |
6.52 mm |
4 |
8 |
S-63 |
4.87 mm |
0 |
10 |
| |
|
|
|
|
Table 4:
Plant Data - Samples, Circle "A"
Edmonton, Canada Crop Circle
September, 1999
|
|
SAMPLE # |
MEAN APICAL
NODE LENGTH (mm) |
EXP. CAVITIES/
SAMPLE SET
(Apical Nodes Only) |
NUMBER
PLANTS/SET |
|
[Circle "A," 19'-diameter NW circle]
|
S-64 |
7.08 mm |
2 |
11 |
S-65 |
6.74 mm |
2 |
9 |
S-66 |
6.94 mm |
2 |
10 |
|
S-67 |
6.71 mm |
3 |
11 |
S-68 |
7.62 mm |
0 |
9 |
|
|
|
|
|
Table 5:
Plant Data - Samples, Randomly Downed Area
Edmonton, Canada Crop Circle
September, 1999
|
|
SAMPLE # |
MEAN APICAL
NODE LENGTH (mm) |
EXP. CAVITIES/
SAMPLE SET
(Apical Nodes Only) |
NUMBER
PLANTS/SET |
|
|
R-1 |
4.77 mm |
1 |
9 |
R-2 |
5.12 mm |
3 |
9 |
|
|
|
|
|
X-RAY DIFFRACTION
ANALYSIS:
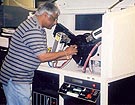 Dr. Sampath S.Iyengar, a geochemist/minerologist and X-ray diffraction and materials science specialist, carried out the clay mineral extractions and X-ray diffraction (XRD) analysis at his analytical materials laboratory (Technology of Materials) in San Diego, California (now located in Wildomar, CA). Dr. Iyengar was recommended by a colleague because of his acknowedged expertise in the XRD technique; it was a further bonus that he was also totally unacquainted with the crop circle phenomenon or any of the controversy surrounding it, thus further protecting this analysis from any experimenter bias. Dr. Sampath S.Iyengar, a geochemist/minerologist and X-ray diffraction and materials science specialist, carried out the clay mineral extractions and X-ray diffraction (XRD) analysis at his analytical materials laboratory (Technology of Materials) in San Diego, California (now located in Wildomar, CA). Dr. Iyengar was recommended by a colleague because of his acknowedged expertise in the XRD technique; it was a further bonus that he was also totally unacquainted with the crop circle phenomenon or any of the controversy surrounding it, thus further protecting this analysis from any experimenter bias.
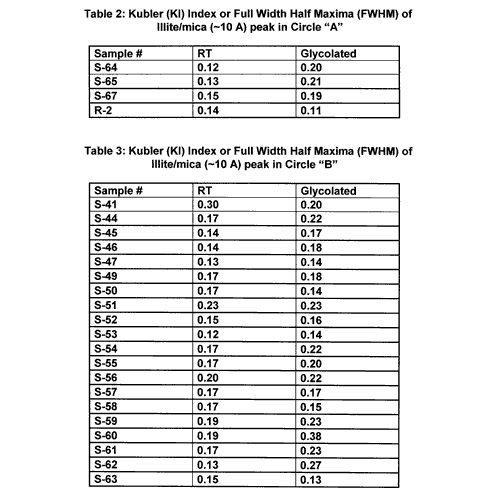
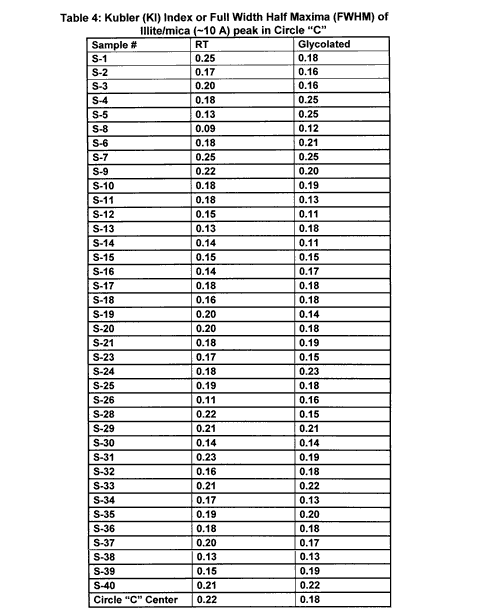
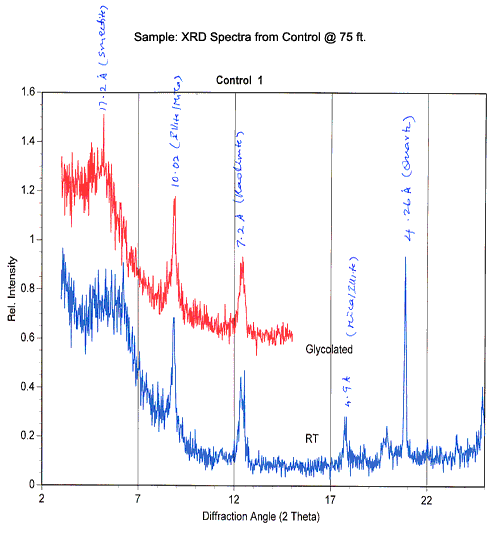
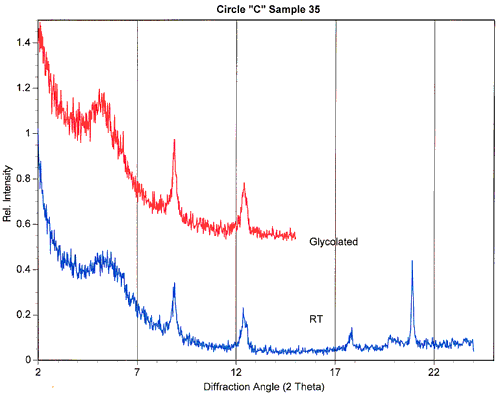
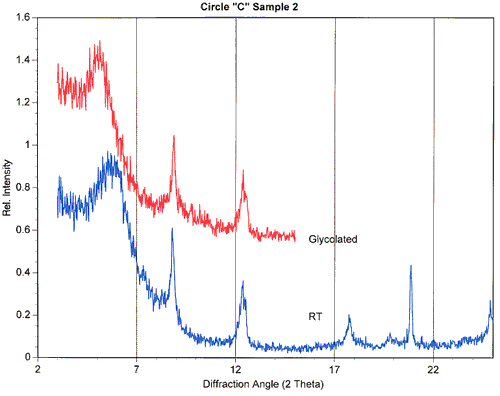
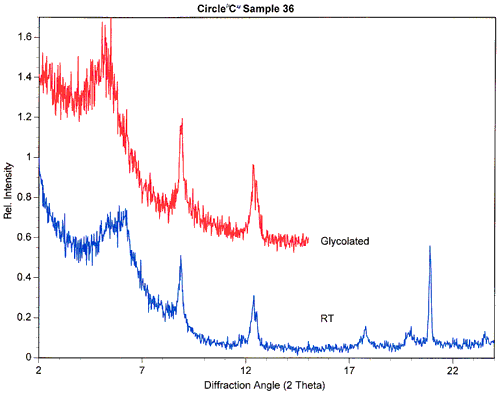
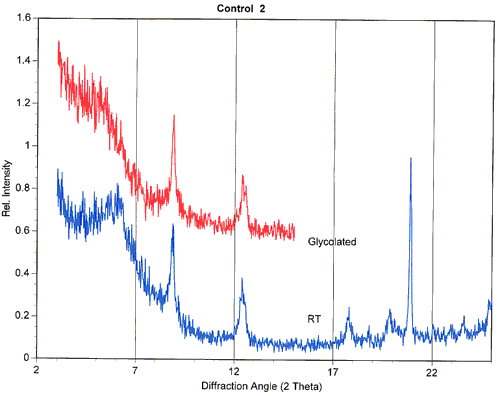
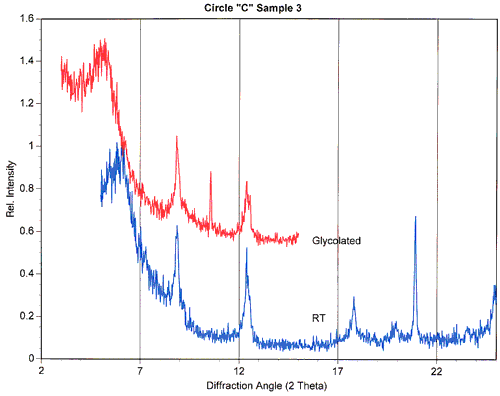
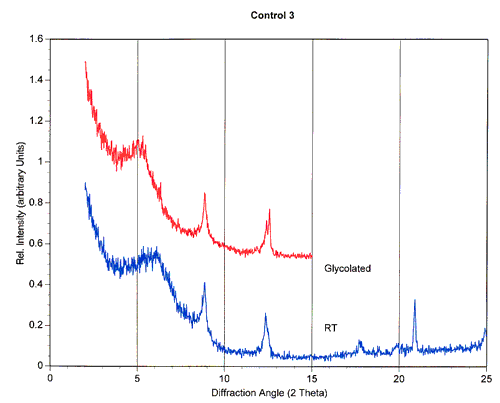
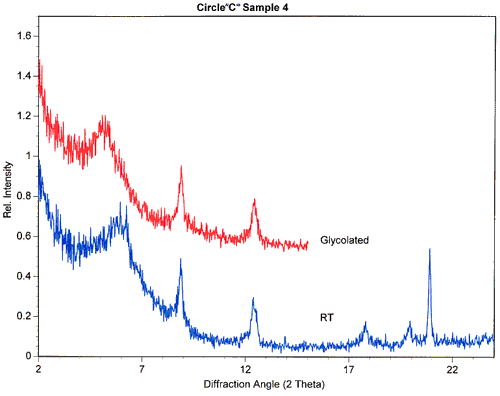
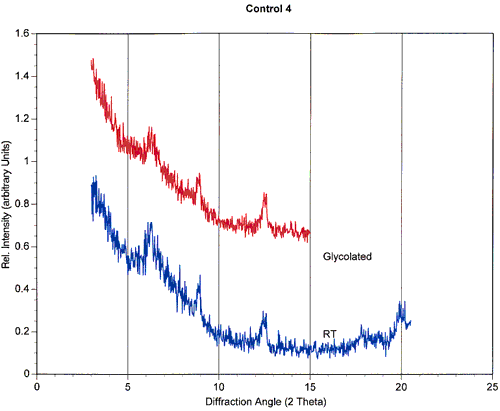
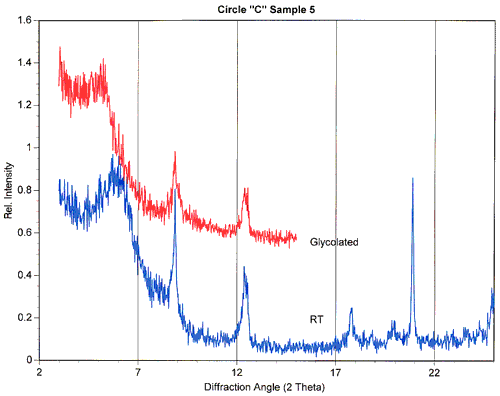
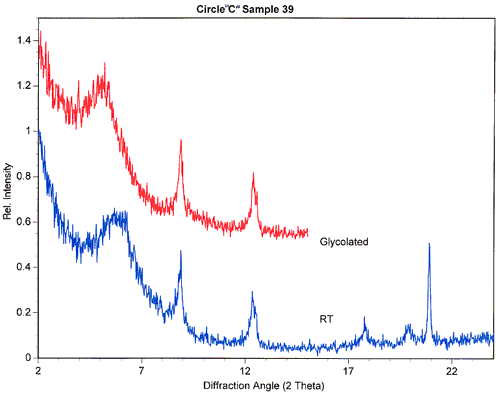
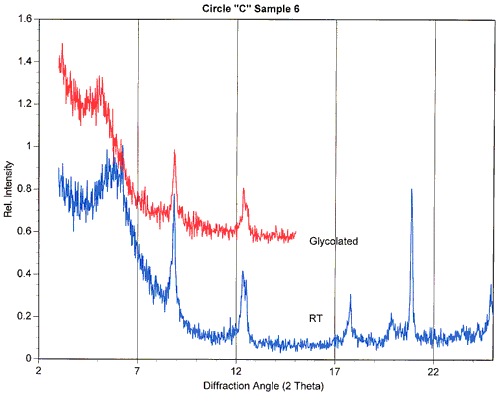
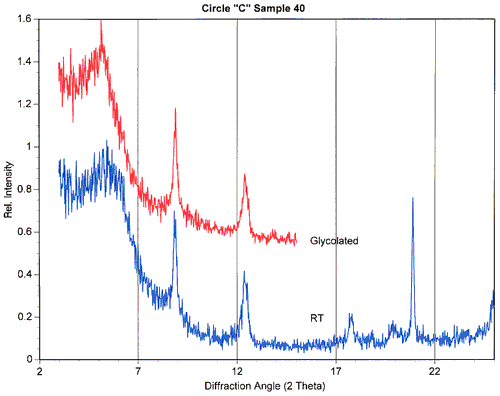
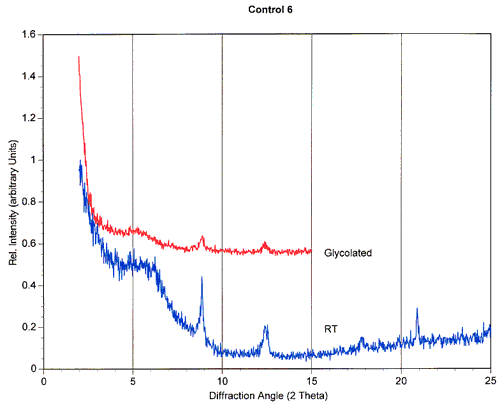
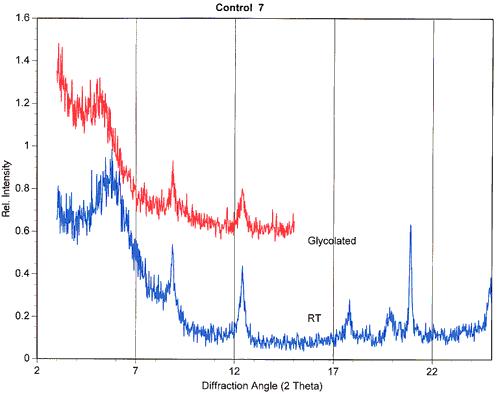
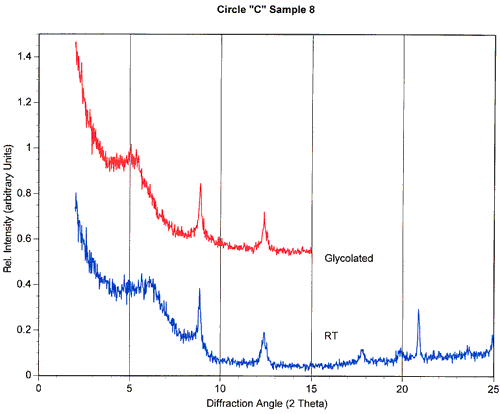
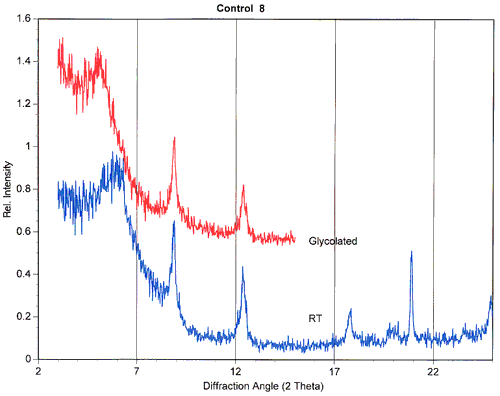
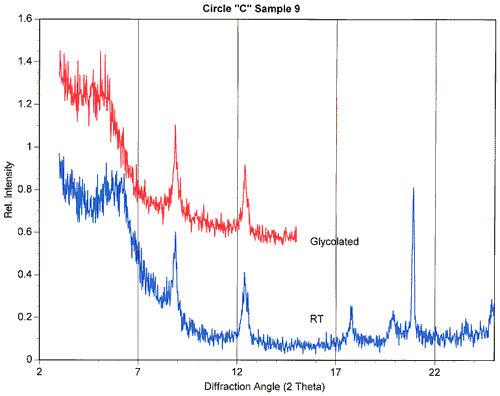
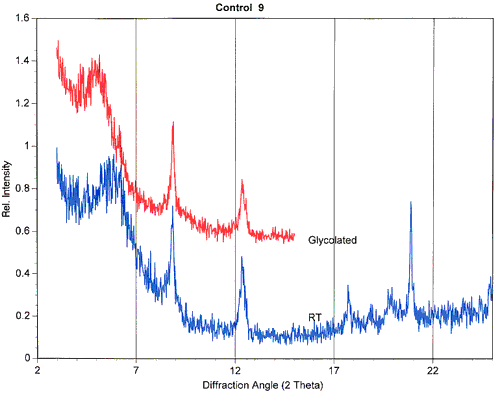
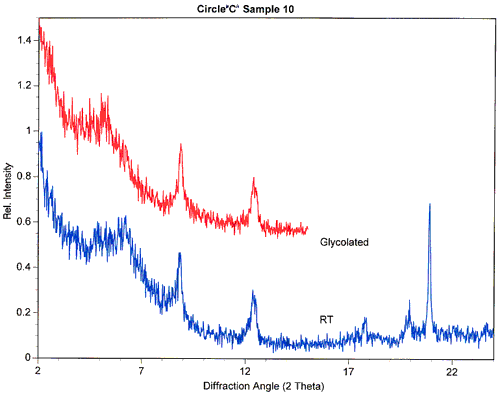
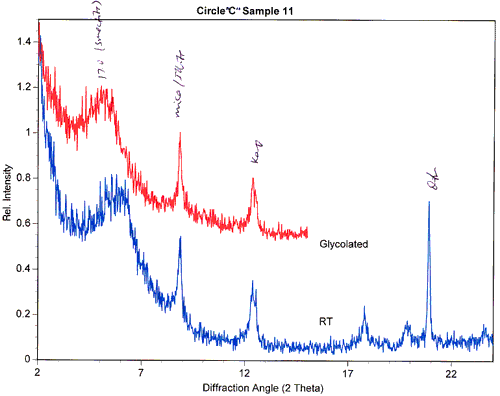
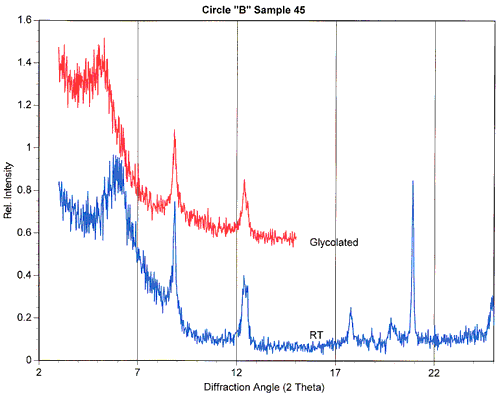
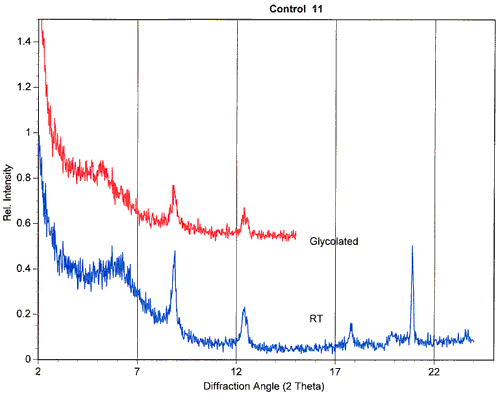
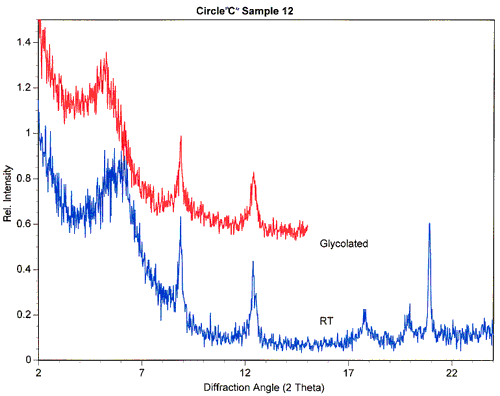
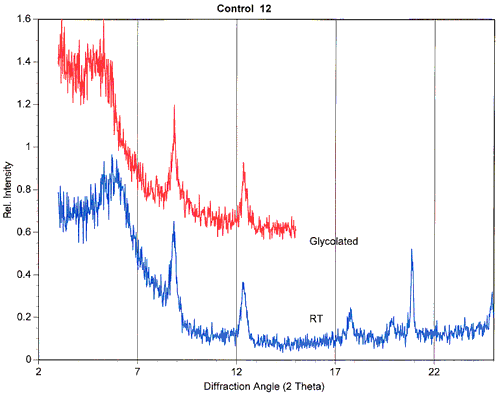
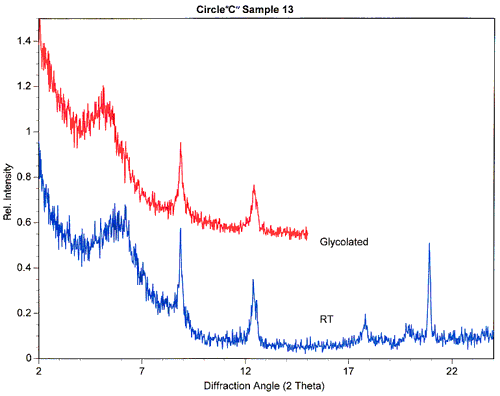
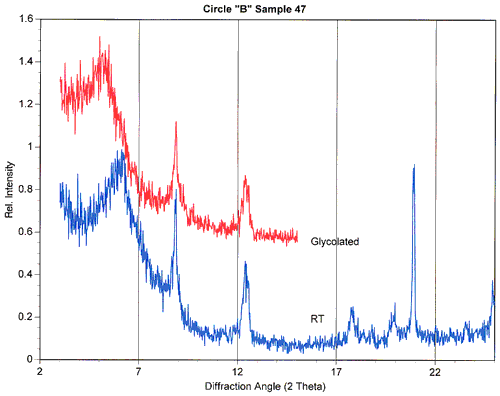
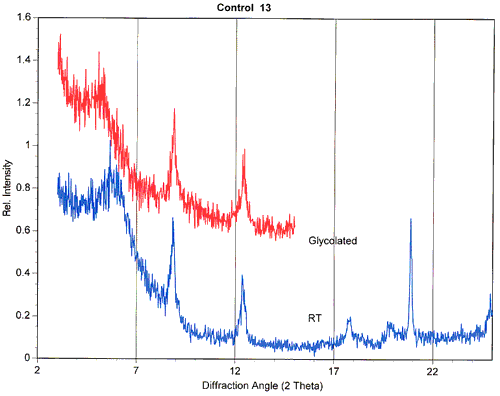
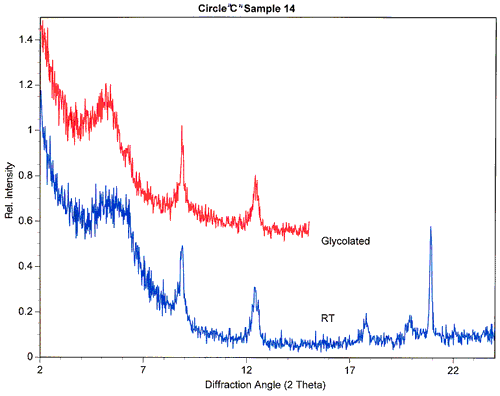
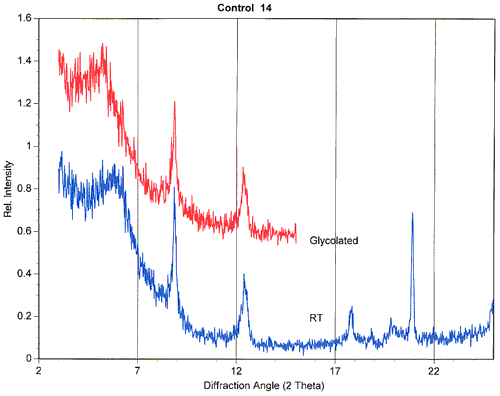
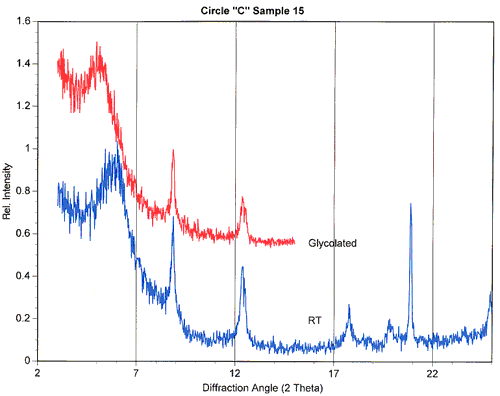
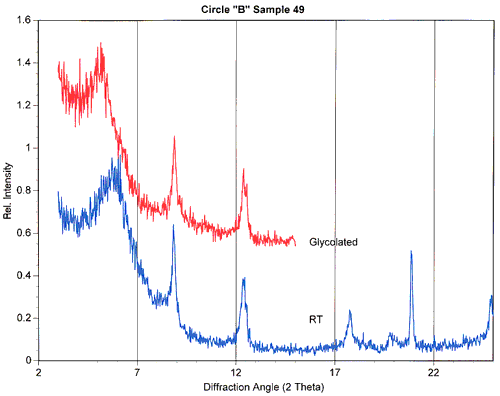
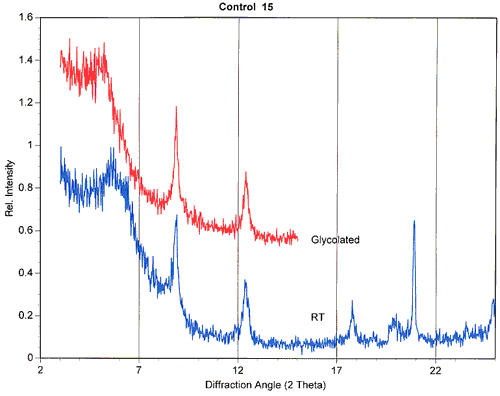
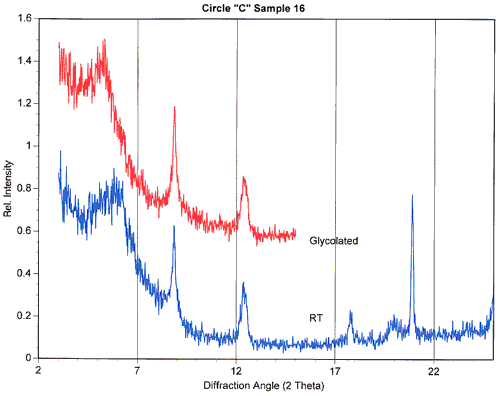
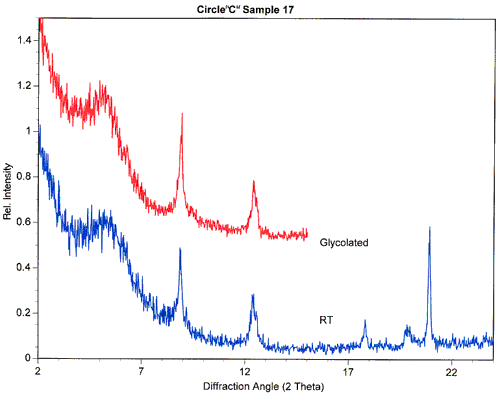
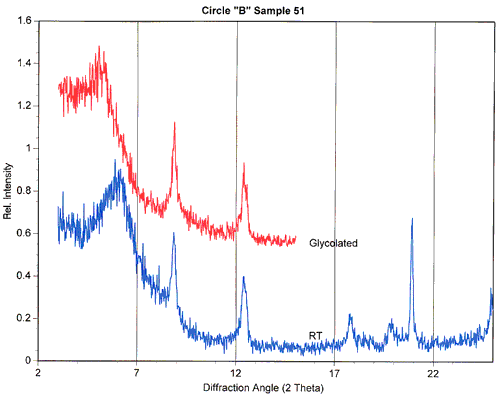
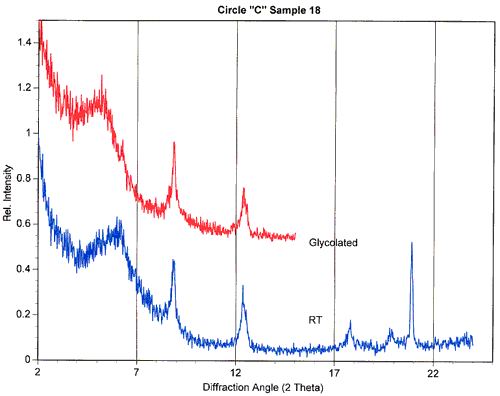
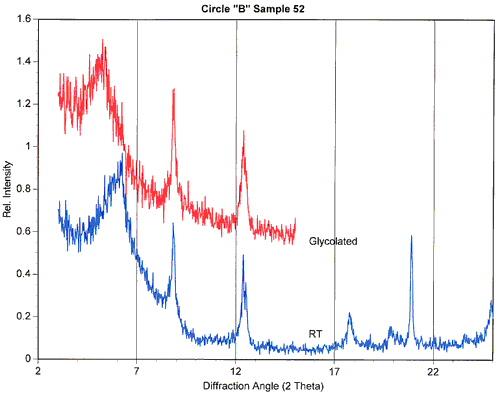
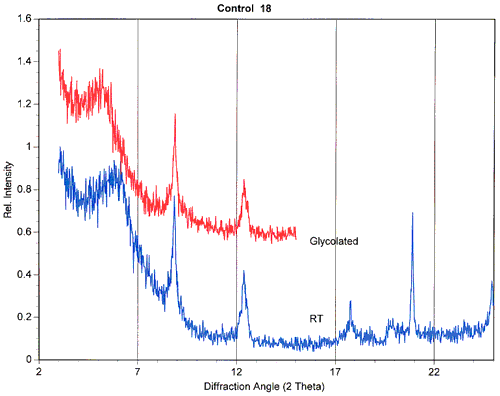
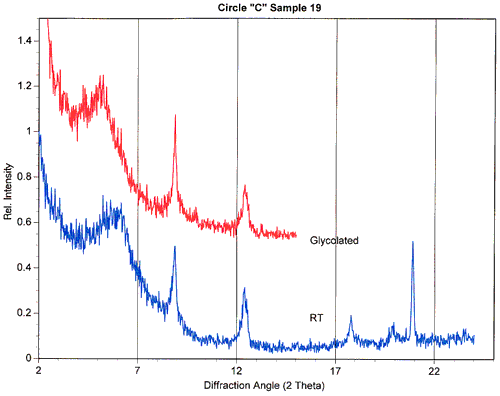
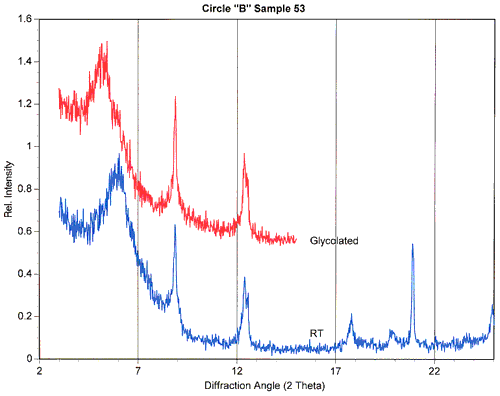
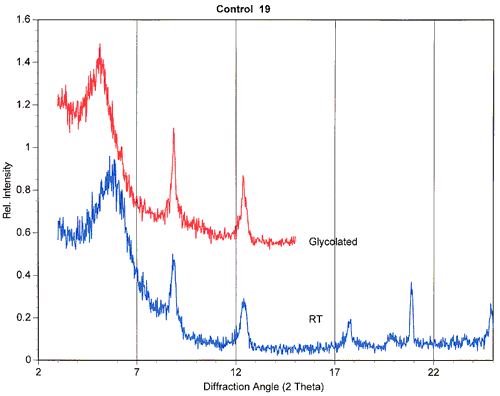
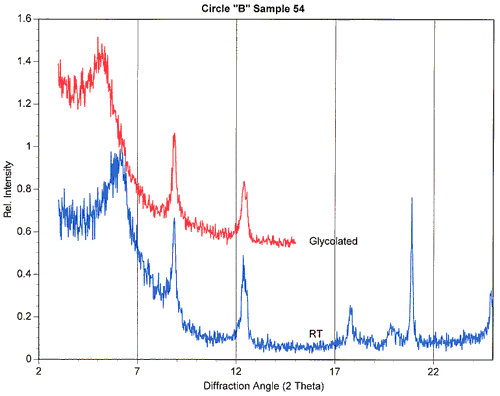
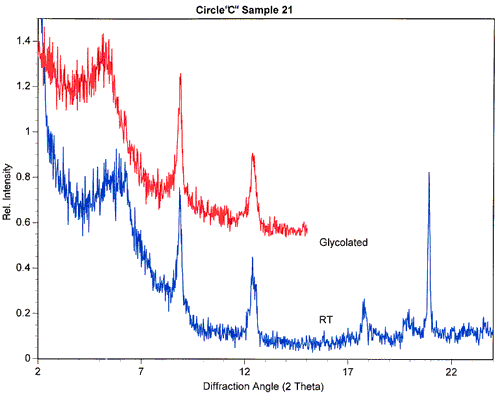
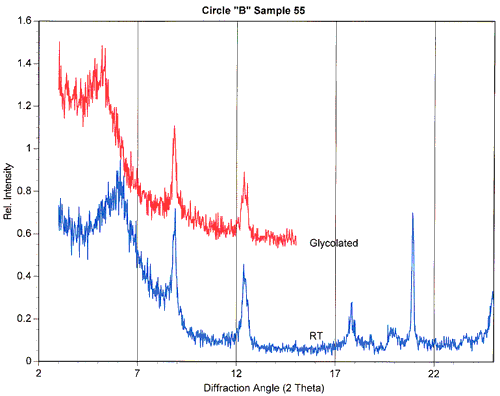
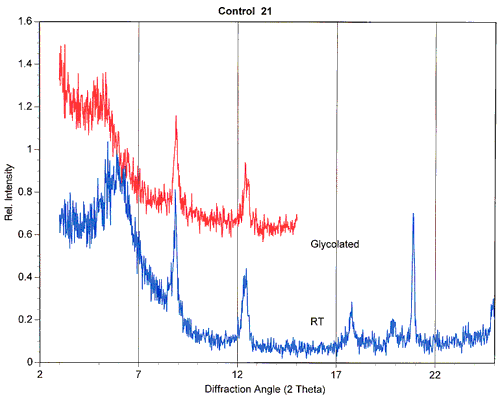
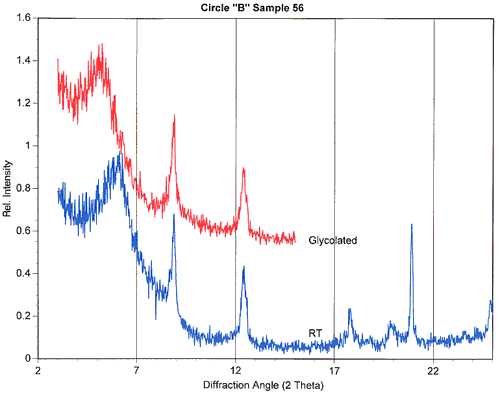
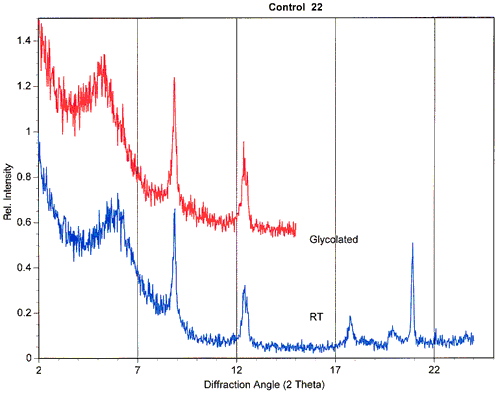
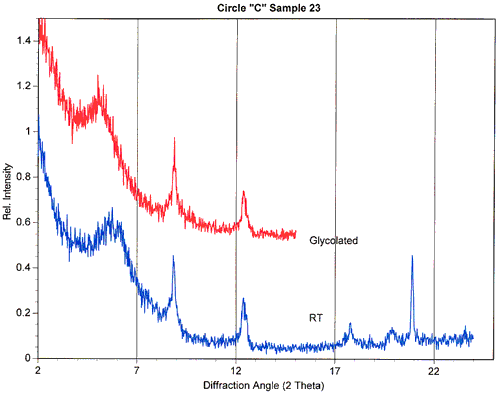
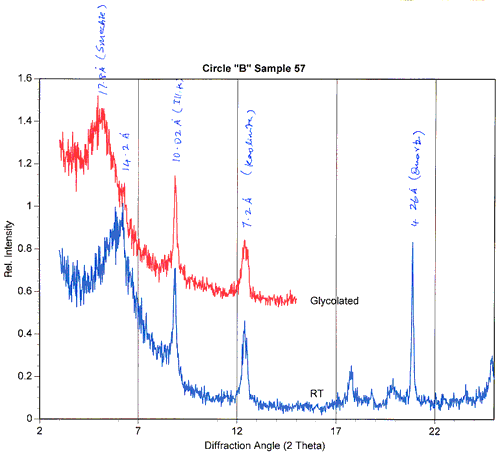
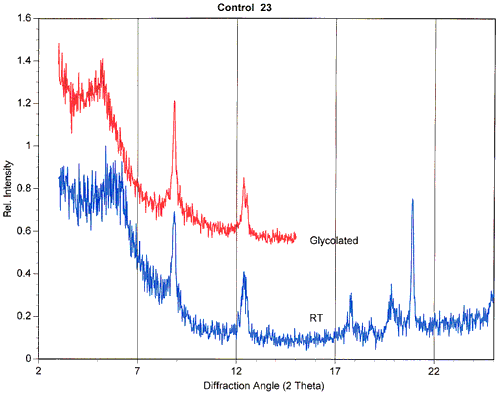
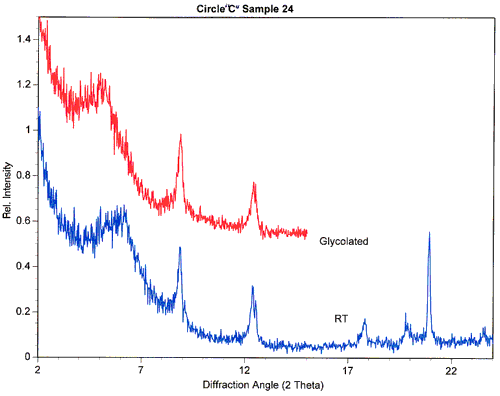
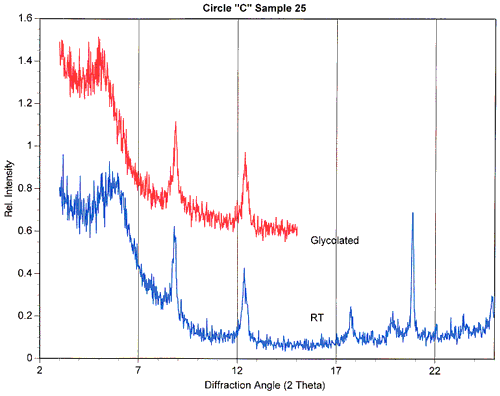
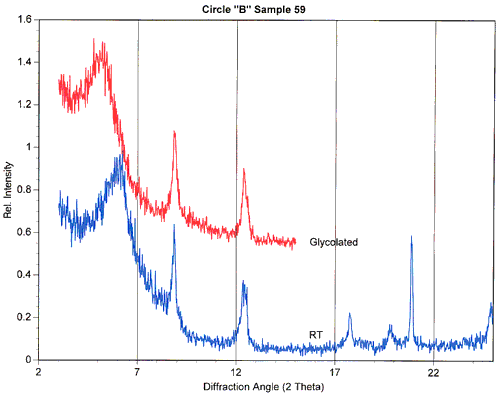
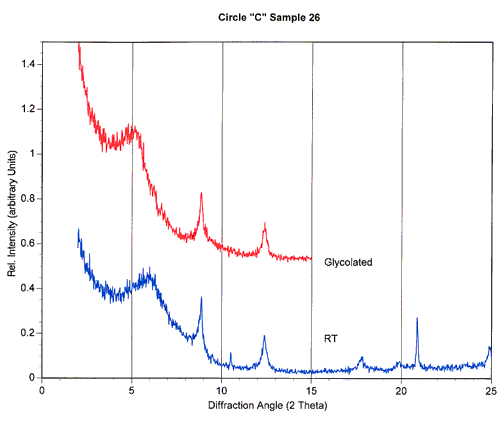
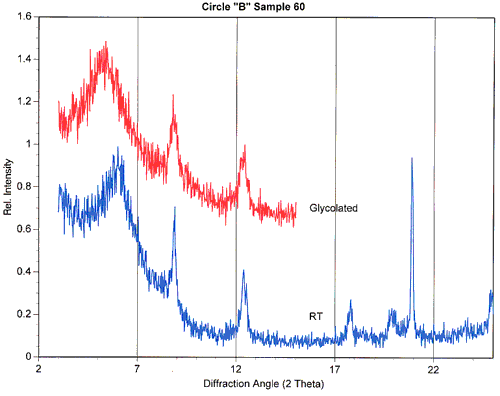
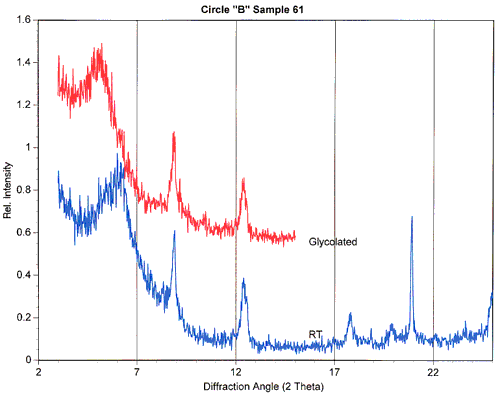
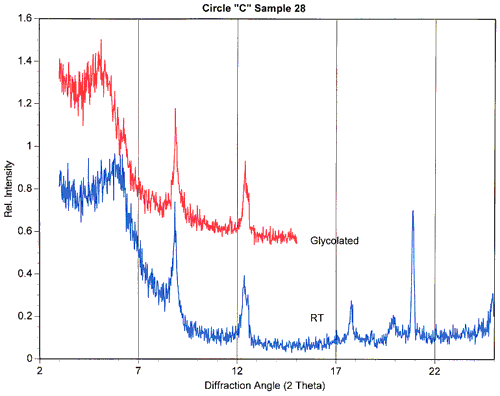
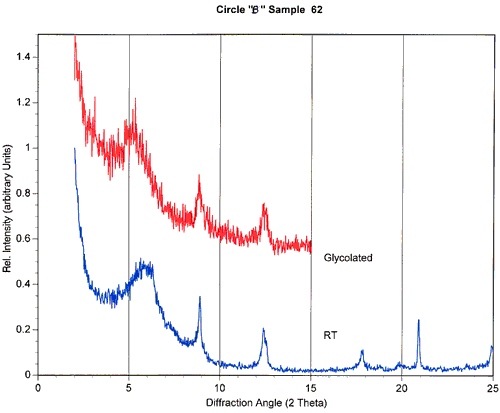
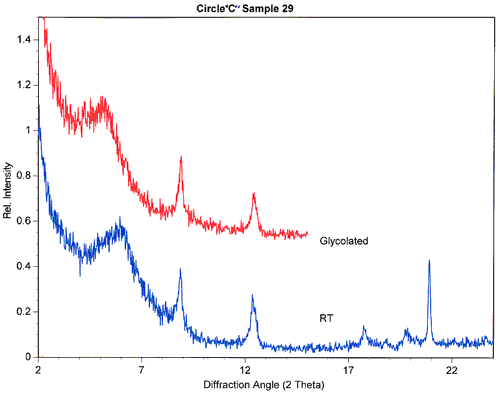
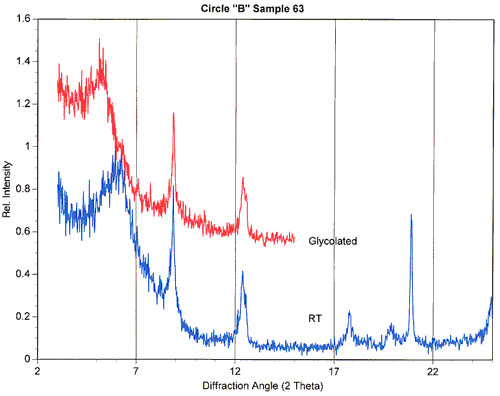
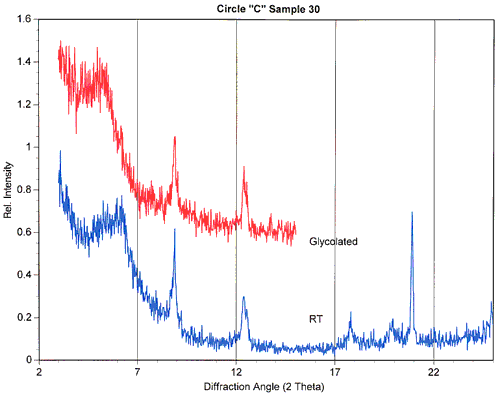
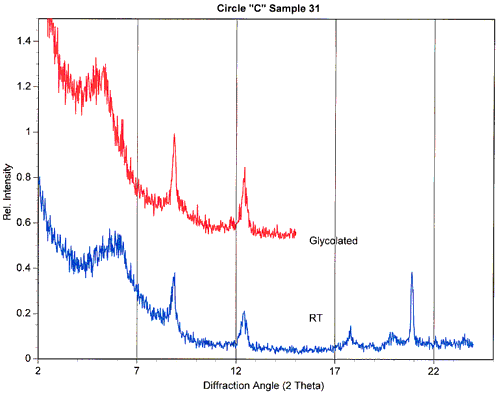
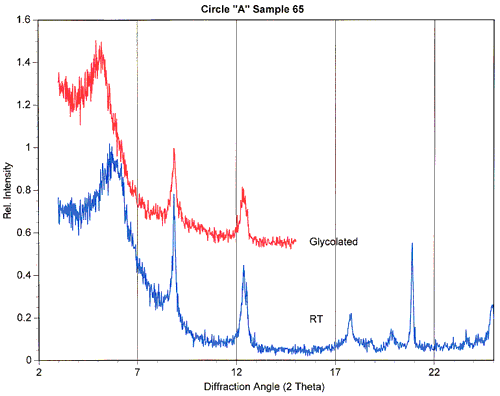
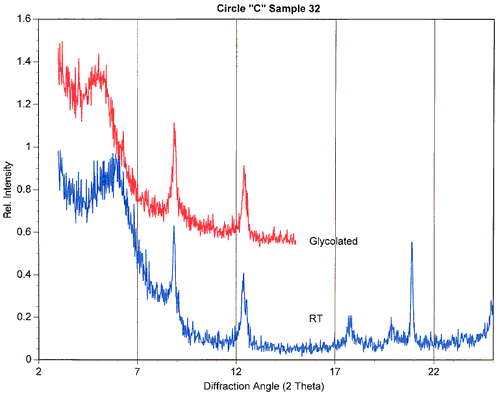
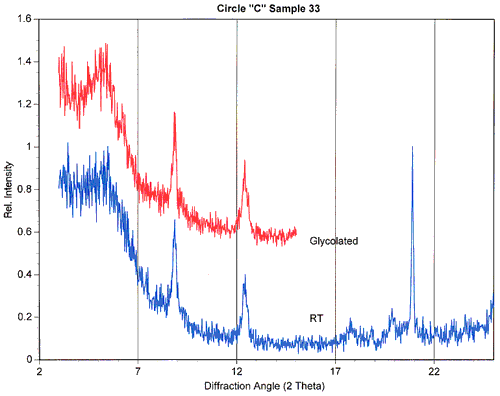
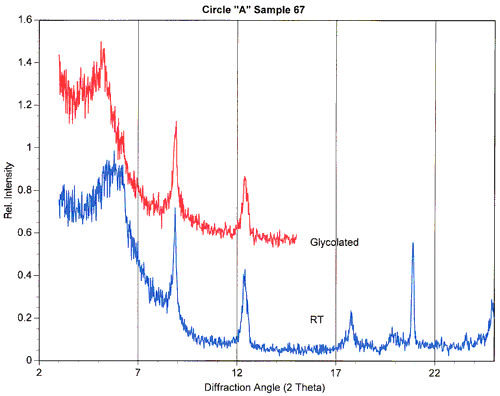
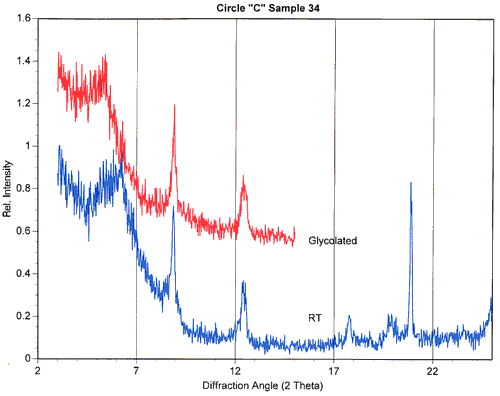
XRD is regularly used to evaluate degree of crystallinity in specific clay minerals. As x-rays are refracted from the sample mounts printed graphs are produced with multiple peaks which represent specific clay minerals--it is the width of these peaks, at half-height, which produces the value known as the Kubler Index (KI), a known indicator of degree of crystallinity in the sample. As the width of the peak narrows, the KI value decreases.
Decreases in KI are indicative of increased crystallinity and, when this change is subtle, large number of samples are required to prove that the change is statistically significant--and therefore meaningful. Illite/smectites (because they are the most expandable of clay minerals and therefore thought to be the most likely to provide evidence of having been exposed to heat), and specifically the mica 001 peaks, were examined.
Dr. Iyengar's full report follows below.
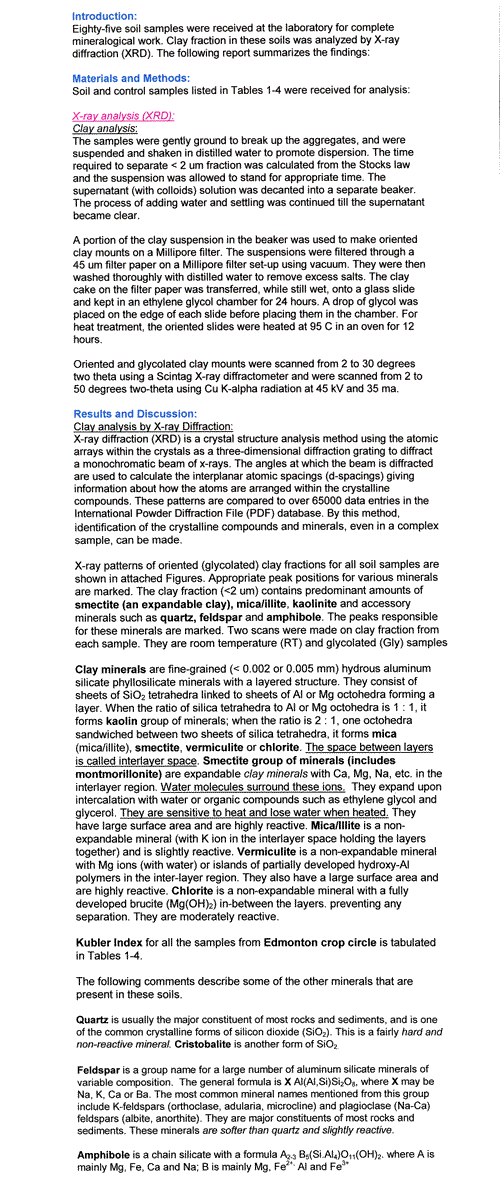
Sample: XRD Spectra from Sample #50
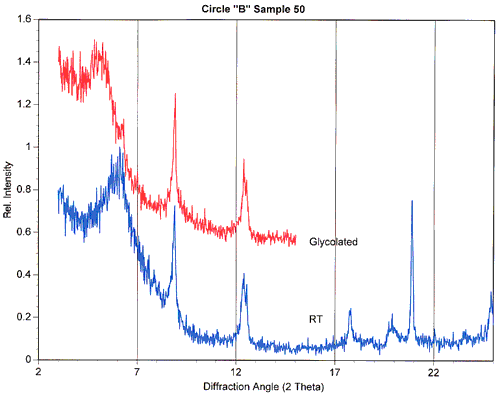
To examine the XRD spectra for each of the samples and/or controls,
click on the specific Sample or Control number, below:
STATISTICAL
ANALYSIS:
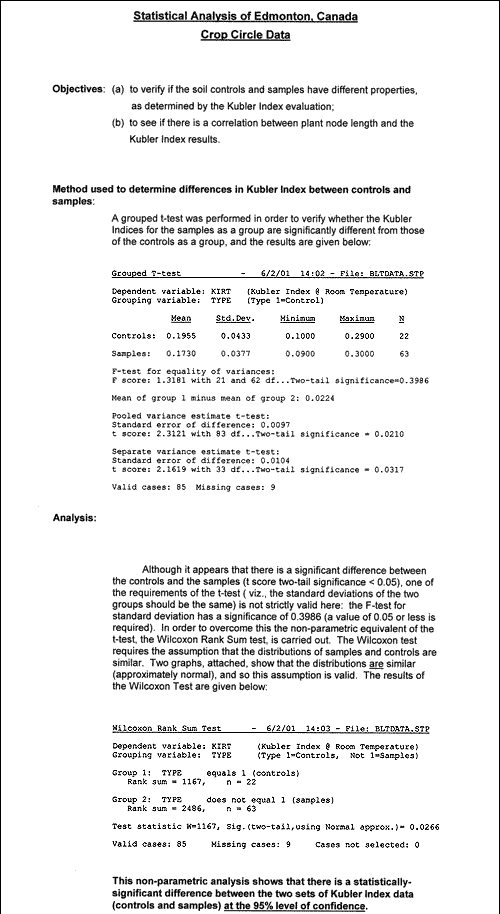
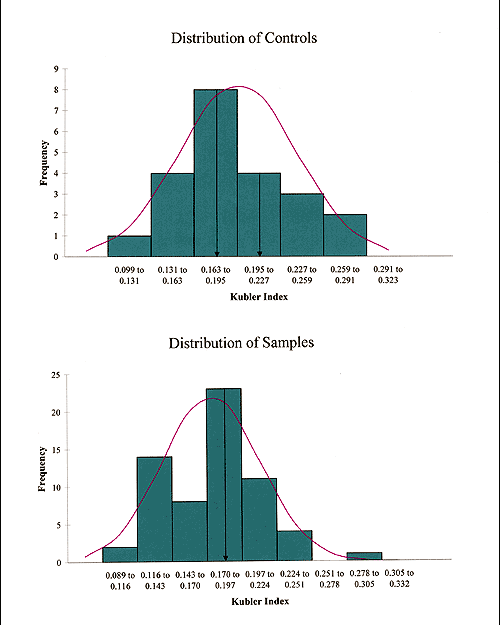
 Upon completion of the XRD work the Kubler Index (KI) data was submitted to Ohio statistician, Dr. Ravi Raghavan for analysis. Dr. Raghavan's first objective was to establish whether there were differences in the KI values between the Edmonton soil samples and controls and, if there were, to determine whether these differences were statistically significant. Upon completion of the XRD work the Kubler Index (KI) data was submitted to Ohio statistician, Dr. Ravi Raghavan for analysis. Dr. Raghavan's first objective was to establish whether there were differences in the KI values between the Edmonton soil samples and controls and, if there were, to determine whether these differences were statistically significant.
As stated at the beginning of this report ("Study Results"), a sharpening of the mica 001 peak (a decrease in the KI, indicating growth of the illite/mica crystals) was found in the cropcircle soils, as compared with the control soils. Further, this increase was found to be statistically significant at the 95% level of confidence.
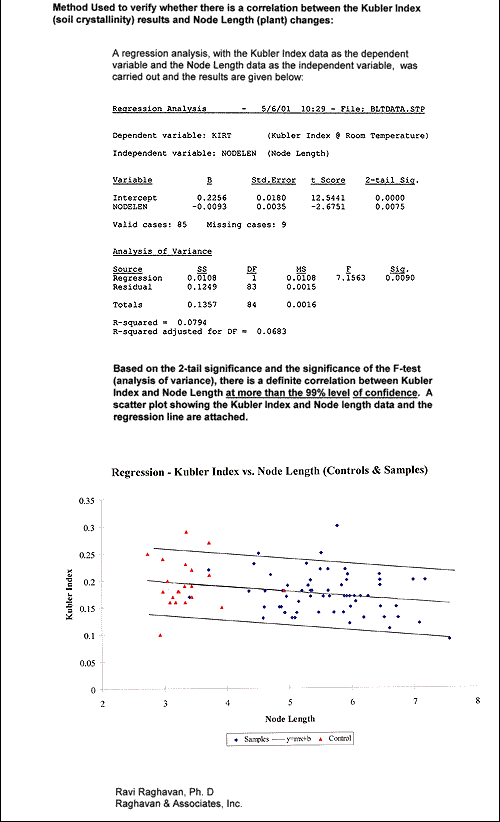
Dr. Raghavan was then sent W.C. Levengood's node-length data and asked whether a correlation existed between the plant node-length increases and increase in soil crystallinity at the same sampling locations. The regression analysis indicates that there is a correlation between Kubler Index and Node Length, at more than the 99% level of confidence.
Dr. Raghavan's statistical report follows below.
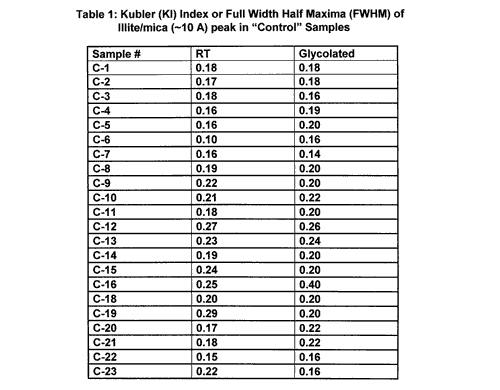
MINERALOGICAL
REVIEW:
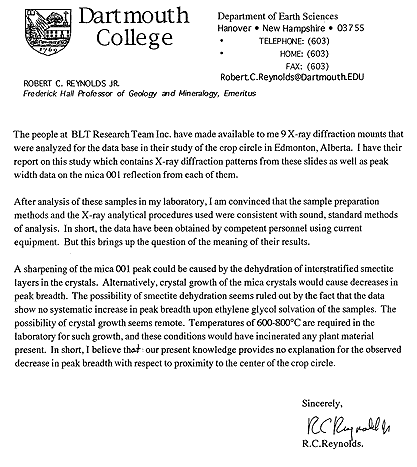
 We were extremely fortunate, at this time, to be able to consult with Dartmouth College geologist/mineralogist Robert C.Reynolds, Jr., described by his colleagues as "a brilliant scientist and without any exaggeration ... the best known expert in the world of X-ray diffraction analysis of finely-dispersed layer compounds, and first of all, of clay minerals" (D.M. Moore, "Presentation of the Roebling Medal of the Mineralogical Society of America for 2000 to Robert Coltart Reynolds, Jr., Am. Mineralogist 86:943-45, 2001). We were extremely fortunate, at this time, to be able to consult with Dartmouth College geologist/mineralogist Robert C.Reynolds, Jr., described by his colleagues as "a brilliant scientist and without any exaggeration ... the best known expert in the world of X-ray diffraction analysis of finely-dispersed layer compounds, and first of all, of clay minerals" (D.M. Moore, "Presentation of the Roebling Medal of the Mineralogical Society of America for 2000 to Robert Coltart Reynolds, Jr., Am. Mineralogist 86:943-45, 2001).
Currently Frederick Hall Professor of Geology and Mineralogy, Emeritus, Dr. Reynolds examined our work and stated that he was
"...convinced that the sample preparation methods and the X-ray analytical procedures used were consistent with sound, standard methods of analysis. In short, the data have been obtained by competent personnel using current equipment."
Reynolds, however, wondered whether the observed sharpening of the mica 001 peak might be caused by the dehydration of inter-stratified smectite layers in the crystals and asked that additional statistical work be carried out to evaluate this possibility. A paired t-test was then conducted, comparing the KIs in both the RT and glycolated conditions, but no significant difference was found with, or without, glycolation, again at the 95% level of confidence. This was true for each of the sampled circles individually and all of the sampled circles combined.
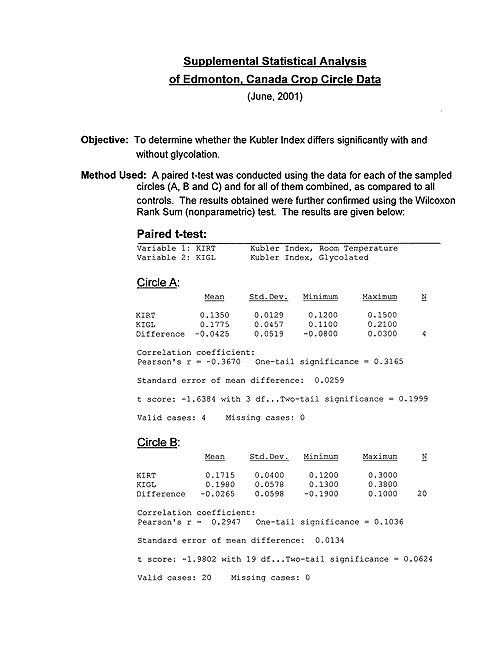
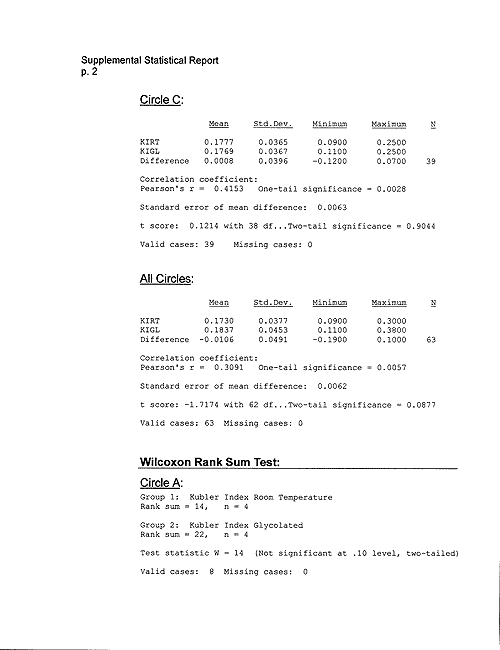
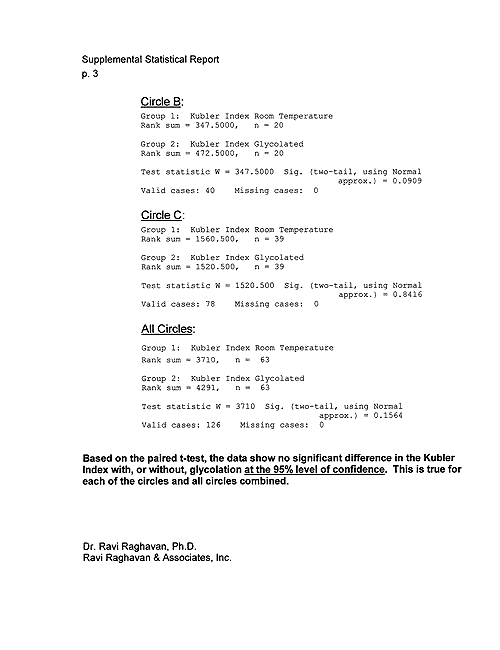
Following this additional statistical inquiry into the possibility that loss of interstitial water might account for the subtle sharpening of the mica 001 peak, Reynolds concluded that
"The possibility of smectite dehydration seems ruled out by the fact that the data show no systematic increase in peak breadth upon ethylene glycol solvation of the samples."
Finally, because Diane Conrad's preliminary work suggested that microwave exposure (the Kubler Index of her control aliquot decreased from 0.25 to 0.07 after having been exposed to microwaves for two minutes) might produce a decrease in the Kubler Index similar to the decrease she observed in the Logan, Utah circle samples, we asked Dr. Iyengar to expose a few of our control samples from the Edmonton formation to microwaves for varying periods of time to see if we could replicate this effect.
Eight controls (C-3, C-9, C-12, C-13, C-15, C-16, C-19 and C-23), for which the KI values were already known, were placed in a commercial microwave oven for one minute, then ten minutes, and then 60 minutes, and their KIs again determined. From the results below it is clear that microwaving produced no consistent or significant change in KI in these Edmonton control samples.
Kubler Index (KI) or Full Width Half Maxima (FWHM) of
Illite/Mica (~10 A) Peak in Microwaved Controls |
Control # |
RT |
1 Minute |
10 Minutes |
60 Minutes |
C-3 |
(0.18) |
0.17 |
0.16 |
0.17 |
0.19 |
C-9 |
(0.22) |
0.23 |
0.17 |
0.23 |
0.27 |
C-12 |
(0.27) |
0.22 |
0.22 |
0.25 |
0.18 |
C-13 |
(0.23) |
0.20 |
0.19 |
0.22 |
0.26 |
C-15 |
(0.24) |
0.25 |
0.21 |
0.18 |
0.23 |
C-16 |
(0.25) |
0.21 |
0.21 |
0.19 |
0.16 |
C-19 |
(0.29) |
0.21 |
0.19 |
0.20 |
0.20 |
C-23 |
(0.22) |
0.21 |
0.20 |
0.20 |
0.18 |
| Numbers in parenthesis are previously obtained RT values for these controls. |
DISCUSSION:
The study reported here examined both the barley plants (Hordeum vulgare) and specific clay minerals (illites/smectites) extracted from surface soils at a 1999 Edmonton, Alberta, Canada 7-circle crop formation. Both plant and soil samples were taken at each of 69 sampling locations within three of the circles (plus two additonal "samples" taken from a randomly-downed area outside the main formation), and at 24 control locations 75-265' away from the flattened edges of the formation.
In the plants, statistically significant (p <0.01) apical node-length increases were found in all of the 71 plant sample sets, compared with the mean of the controls. Additionally, 68% of the plant samples contained expulsion cavities in one or several plant stem nodes in each plant, while none were found in the controls. Based on previous research (see "Published Papers"), microwave radiation has been proposed as a possible causative mechanism for the plant stem changes found in this case, and also consistently in many other cases around the world over the last 10-12 years.
Clay minerals (illite/smectites) extracted from surface soils taken at the same sampling locations as the plants, were submitted to X-ray diffraction analysis, resulting in Kubler Index values for both the room temperature (RT) and glycolated condtions. Analysis of the XRD results shows a subtle, but statistically significant (at the 95% level of confidence), sharpening of the mica 001 peak in the circle samples, suggesting crystal growth.
Dr. Reynolds, a world authority in clay minerology, raised the question as to whether this sharpening of the mica 001 peak might have been caused by the dehydration of interstratified smectite layers in the crystals. In response to this possibility, a paired t-test comparing the room temperature (RT) condition to the glycolated condition was conducted, but smectite dehydration seems to be ruled out by the fact that the data show no systematic increase in peak breadth upon ethylene glycol solvation of the samples (again, at the 95% level of confidence).
In Reynold's words, "the possiblity of crystal growth seems remote." The degree of pressure known to be involved in causing crystal growth in sedimentary deposits would have, had it been present, completely obliterated the plants. And the 600-800ßC temperatures, over a period several hours, known to be necessary to promote such crystal growth in the laboratory would have, in the crop circle field, incinerated any plant material present. Additionally, the very brief bursts of possibly intense microwave radiation thought to be the cause of node-elongation and the creation of expulsion cavities (through heating and expansion of internal stem moisture) could not account for crystal growth.
And yet statistical analysis reveals both a subtle decrease in the KI of circle samples as compared to controls, and a definite correlation between the KI and Node Length data -- at more than the 99% level of confidence. It seems evident that whatever caused the decreased KI (increased crystal growth) in the clay minerals in the soils was also responsible for the plant abnormalities.
Our present knowledge provides no explanation for these results. It is unlikely that an atmospheric plasma vortex system could account for the changes observed in the clay minerals. The data, however, rule out direct mechanical flattening of the crop circle plants by human beings utilizing planks or boards as an explanation for this event. Control studies carried out by BLT over the last several years have shown that significant node-length increase and expulsion cavities do not occur in crop flattened by boards or planks, human feet or cement rollers, or to crop which has been 100% over-fertilized. And, since either geologic pressure and/or intense heat is required to cause decrease in KI of the clay minerals--and neither can be produced by planks, boards, cement rollers, feet, etc.--this, or a similar mechanical mechanism, must be ruled out. It is our intent to carry out additional plant and soil research in an attempt to replicate the results of this XRD study, if funding can be obtained.
It should be mentioned that the farmer/owner of the field and his wife, as well as an unrelated individual, reported dramatic aerial light phenomena in the immediate area of this crop field around the time the formation was discovered, as well as the fact that cell phone failure was observed during sampling inside the formation. Reports of similar events at other cropcircle sites around the world are increasingly common. Whether these incidents are relevant is not known, but it is our opinion that they should not be dismissed without investigation if further scientific study cannot provide an adequate explanation for the data.
STUDY
PERSONNEL:
| |
| MIKE & JUDY ARNDT |
.......................................... |
BLT Inc. Field-Team |
|
| |
| DIANE L. CONRAD |
................................................... |
Geologist |
| |
M.S. in Geological Sciences and Clay Chemistry,
State Univeristy of New York (SUNY) |
| |
[thesis: "Heat Effects on Clay Minerals"] |
|
| |
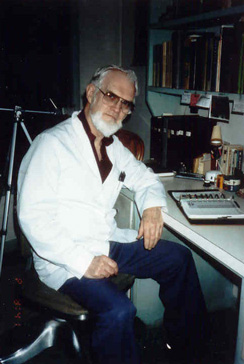
| DR. SAMPATH S. IYENGAR |
................... |
Geochemist/Minerologist |
| |
Ph.D in Materials Chemistry/Minerology, VA Tech
M.S. in Soil Physical Chemistry, VA Tech |
| |
X-ray diffraction (XRD) and materials science specialist.
Owner/analytical manager of Technology of Materials
Laboratory, San Diego, CA |
|
| |
| WILLIAM C. LEVENGOOD |
...................................... |
Biophysicist |
| |
M.S in Biophysics, University of Michigan
M.A. in Bioscience, Ball State University |
| |
Has published three peer-reviewed papers (1994; 1995; 1999) on plant/soil abnormalities found in crop circles.
Owner/research scientist, Pinelandia Biophysical
Laboratory, Grass Lakes, MI |
|
| |
| DR. RAVI RAGHAVAN |
............................. |
Chemical Engineer/Statistician |
| |
Ph.D in Chemical Engineering, Purdue University |
| |
Specialist in mathematical modeling and computer simulation of processes.
President of Raghavan & Associates, Inc., Cleveland |
|
| |
| DR. ROBERT C. REYNOLDS, JR |
............... |
Geologist/Clay Minerologist |
| |
Ph.D in Geology, Washington University |
| |
Roebling Medal Recipient (Mineralogical Society of America, 2000)
Frederick Hall Professor of Geology and Minerology,
Emeritus, Dartmouth College, Hanover, NH |
|
| |
| NANCY P. TALBOTT |
.......................................... |
Study Director |
| |
Has co-authored one peer-reviewed paper (1999) on energy dispersion in crop circle plants. President, BLT Research Team Inc., Cambridge, MA |
|
|

